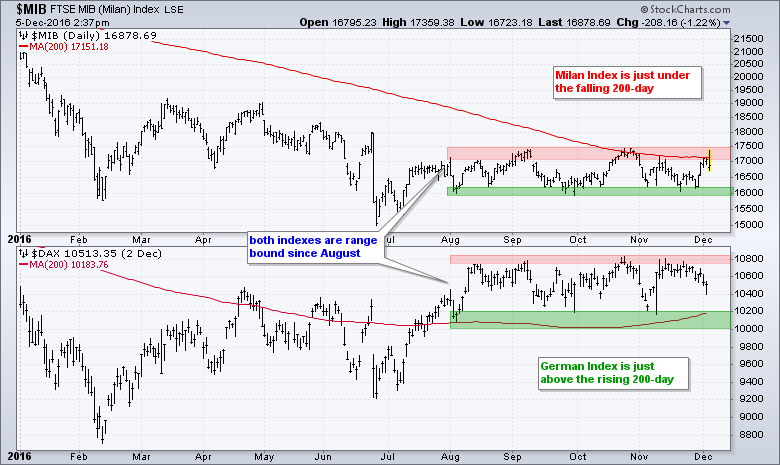
The chart below shows year-to-date price action for the Milan Index ($MIB) and German DAX Index ($DAX). Note that the MIB is down around 22% year-to-date and the DAX is down around 2% since January. In contrast, the S&P 500 is up around 6% so far this year. The next directional move for European stocks could hinge on these two indexes. The Milan Index is in a downtrend overall and just below the 200-day SMA. The highs extending back to August mark resistance in the 17000-17500 area and a breakout here is needed to reverse the downtrend. Such a move would be quite bullish for Italian stocks and this would also benefit Europe.

The bottom window shows the German Index trading above the 200-day SMA since late July. Notice how the DAX established support in the 10200 area with lows in September and November. The rising 200-day SMA is also in this zone. I am inclined to add a buffer and mark support in the 10000-10200 area. The overall trend is up as long as this zone holds. A break below 10000 would reverse this uptrend and be bearish for German stocks - and European stocks. Thus, we have two indexes representing two of the biggest economies in Europe. Both stalled since August and both have clear support/resistance zones to watch. Upside breaks in both would be bullish, while downside breaks in both would be bearish.
****************************************
Thanks for tuning in and have a great day!
--Arthur Hill CMT
Plan your Trade and Trade your Plan
*****************************************
