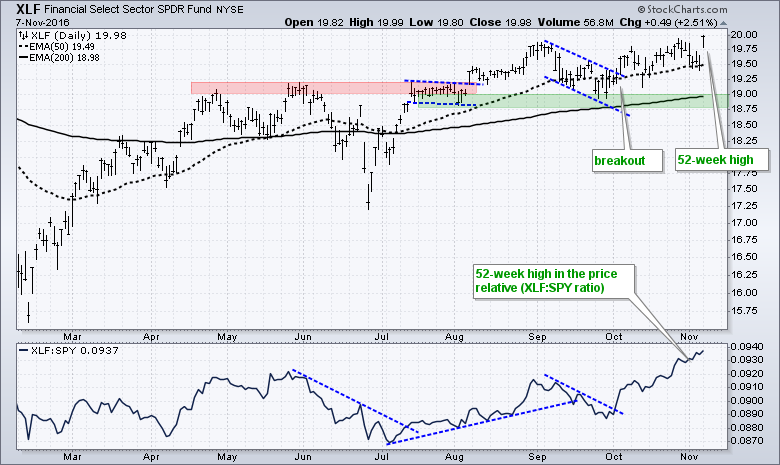
The Finance SPDR (XLF) is leading the sector SPDRs with a new 52-week high on the price chart and with the price relative. On the price chart, XLF triggered its first breakout in early August with a move above the red resistance zone. Even though the ETF did not seem to move much from early August to early November, XLF did hit 52-week highs in early September and late October. These highs confirm that the bulls were always in charge. With today's fresh 52-week high, XLF becomes the only sector SPDR to record a new high. This means it is the chart leader among the sectors. The indicator window shows the price relative (XLF:SPY ratio) also hitting another new high on Monday. This indicator measures the performance of XLF relative to SPY. The ratio rises when XLF outperforms and falls when XLF underperforms. XLF has been outperforming since the early October breakout and the new high simply confirms relative strength.

****************************************
Thanks for tuning in and have a great day!
--Arthur Hill CMT
Plan your Trade and Trade your Plan
*****************************************
