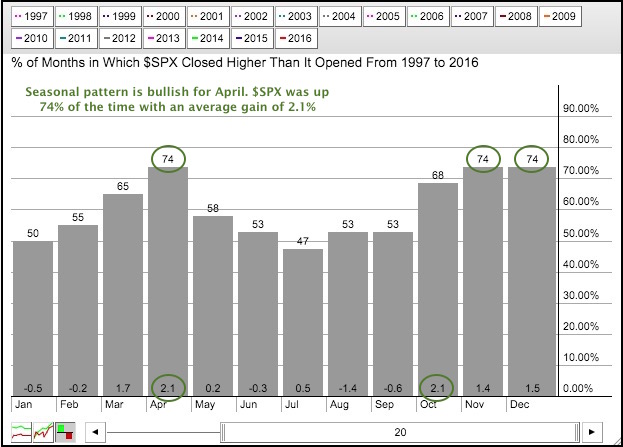
The chart below shows the seasonal patterns for the S&P 500 over the last twenty years. The bars show the percent of months that the S&P 500 closed positive and the numbers at the bottom show the average change. Three months stand out from the rest: April, November and December. Notice that the S&P 500 was up 74% of the time each of these three months. Also notice that March is the fifth strongest month. The S&P 500 is up just over 4% so far this month and living up to its bullish bias. April has an even stronger bullish bias with an average gain of 2.1%. Thus, the seasonal patterns suggest that the surge that began in mid February is set to continue and could even gain steam in April.
 ****************************************
Thanks for tuning in and have a good day!
--Arthur Hill CMT
Plan your Trade and Trade your Plan
*****************************************
