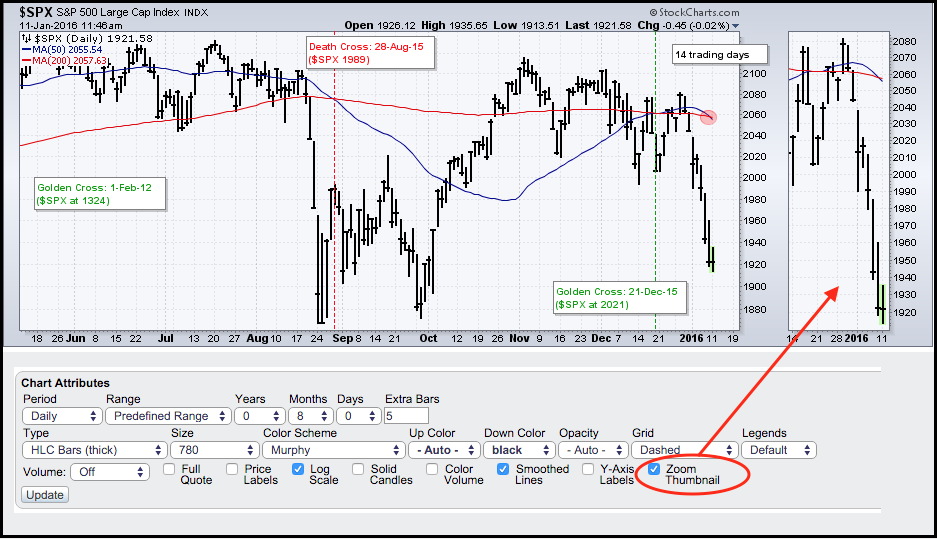
Stocks took it on the chin over the last two weeks with the S&P 500 falling over 7% in just seven trading sessions (30-Dec to 8-Jan). The depth of this decline forced the 50-day moving average down and it is currently below the 200-day moving average. This death-cross, however, is not the only negative on the chart. In addition to comparing price levels to a moving average, chartists can also analyze the direction of the moving average for directional clues. I added a "zoom thumbnail" so we can better see these two moving averages over the last three weeks. The 50-day SMA is clearly pointing down and the 200-day SMA is also moving lower over the last three weeks. Thus, we have an array of bearish trend indications on this chart. The index is below both moving averages, the 50-day is below the 200-day and both moving averages are pointing down. Such a bearish event also occurred in early September. Note that moving averages are lagging indicators and prone to whipsaw when there is no trend. Prior to the recent whipsaws, the 50-day held above the 200-day from February 2012 to August 2015 (strong uptrend).
Note that there was a golden cross as recently as December 21st when the 50-day SMA moved above the 200-day SMA. The S&P 500 also moved above both moving averages in late December, but failed to hold above these moving averages for very long. Should December's golden cross be negated today, it would mark the shortest golden cross signal in over 50 years. This study came from a tweet from Rob Hanna of QuantifiableEdges.
****************************************
Thanks for tuning in and have a good day!
--Arthur Hill CMT
Plan your Trade and Trade your Plan
*****************************************

