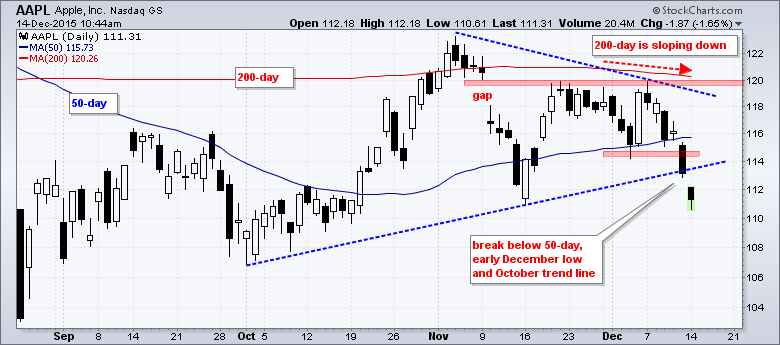
Apple shows signs of a long-term downtrend because it failed at a key long-term moving average and just broke a medium-term moving average. The daily candlestick shows AAPL gapping down in early November, trying to fill that gap with a bounce in mid November and ultimately failing with a peak near 120 last week. Notice that the November-December peaks are just below the falling 200-day moving average, which suggest a long-term downtrend. AAPL fell sharply the last five days and broke below the mid November low today. Even though the stock is short-term oversold after a decline from 120 to 111, the long-term trend appears to down and I will show a downside target in the next chart.
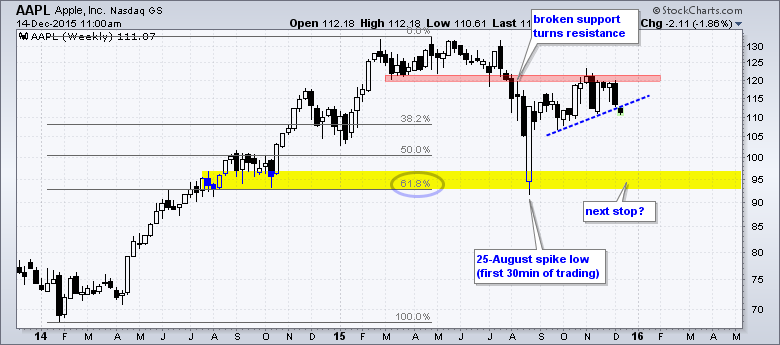
The weekly chart shows the Fibonacci Retracements Tool to estimate price targets. Typically, a security will retrace 38.2% to 61.8% of an advance with 50% being in the middle. This is a big zone so we need to use other technical tools to confirm a downside target. The September-October 2014 lows mark potential support in the 95 area and this is confirmed by 61.8% retracement. The August spike low is also in the 95 area. Keep in mind that price targets should be taken with a grain, or maybe a bucket, of salt. The price target is only valid as long as downtrend remains. A close above 120 would negate this bearish scenario.

****************************************
Thanks for tuning in and have a good day!
--Arthur Hill CMT
Plan your Trade and Trade your Plan
*****************************************

