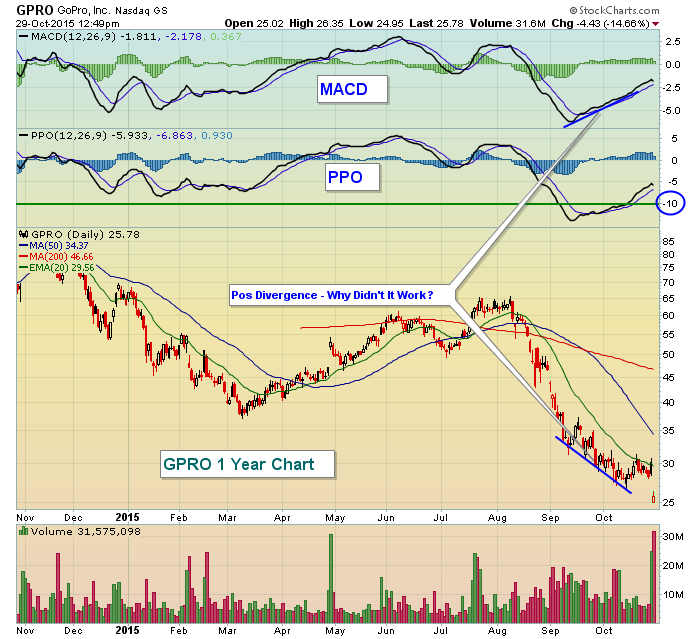
GPRO reported revenues and earnings that fell short of expectations after the bell last night and the reaction was about as you might expect - down 17% on the open. It's since recovered and is attempting to print a significant red hollow candle on massive volume. As a result, a strong finish could mark a short-term bottom. But looking back, GPRO has shown a positive divergence on its MACD since mid-September with little bounce. What's up with that? Well, there's one general rule of mine with regard to the MACD and positive/negative divergences. If the MACD represents more than 10% of its stock price, it becomes almost a mathematical certainty that future highs or lows will result in a negative or positive divergence. While the MACD readings on lower lows do technically suggest slowing momentum on the sell side for GPRO, it relates more to the mathematical certainty than to the selling actually slowing down. Look at this way - GPRO lost 50% of its market cap in one month. If GPRO had kept up that pace of selling, they'd have been out of business by Christmas. OF COURSE their selling momentum slowed. But it was not reflective of a strong buy as the subsequent price action has shown.
In the chart below, I've featured the PPO in addition to the MACD. While the MACD compares two EMAs in terms of price, the PPO does so in terms of percentage. When the PPO moves above +10 or below -10, be careful relying on those negative and positive divergences. Here's the chart:
Technical analysis is generally quite useful in helping us to manage risk, but there's no substitute for common sense.
Happy trading!
Tom

