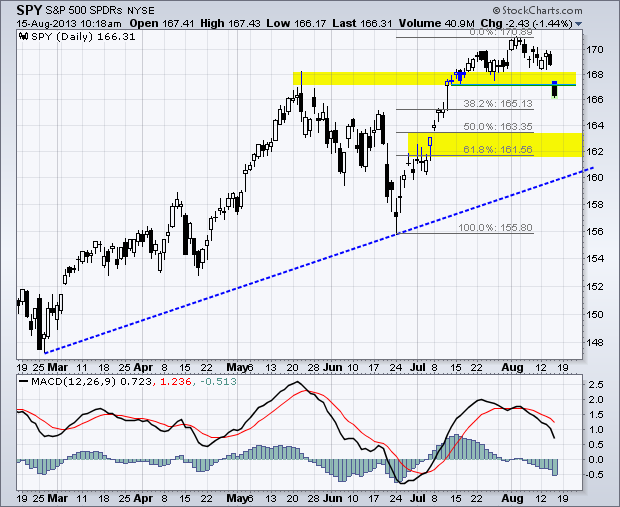
After weeks of indecision, the S&P 500 ETF (SPY) made a decisive move with break below the late July low. The gap and support break are short-term bearish as long as they hold. Using the Fibonacci Retracements Tools, chartists can estimate next support in the 50-62% retracement zone, which equates to the 162-164 area.

Click this image for a live chart

Click this image for a live chart

About the author:
Arthur Hill, CMT, is the Chief Technical Strategist at TrendInvestorPro.com. Focusing predominantly on US equities and ETFs, his systematic approach of identifying trend, finding signals within the trend, and setting key price levels has made him an esteemed market technician. Arthur has written articles for numerous financial publications including Barrons and Stocks & Commodities Magazine. In addition to his Chartered Market Technician (CMT) designation, he holds an MBA from the Cass Business School at City University in London.
Learn More