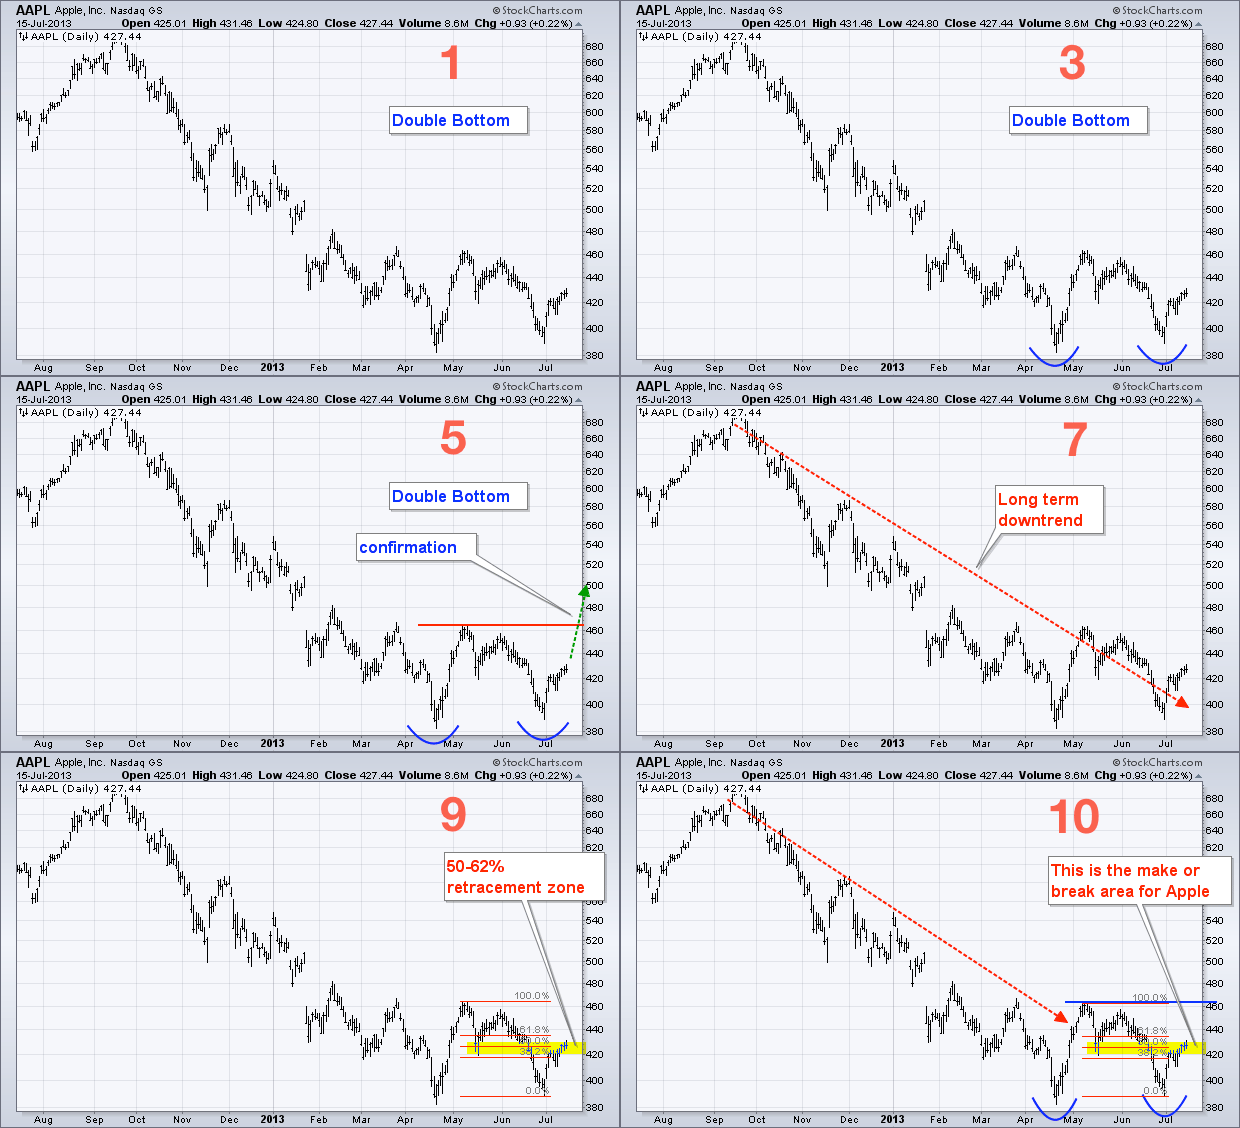
The animated chart below shows Apple at a key resistance zone right now. A double bottom could be forming, but the stock is in a long-term downtrend and stalling in the middle of the three month range. A move above 435 would open the door for a double bottom resistance test. A move below 415 would set up a support test in the 390 area. Note: this animated gif was created with Adobe Elements.

Click this image for a live chart

Click this image for a live chart

About the author:
Arthur Hill, CMT, is the Chief Technical Strategist at TrendInvestorPro.com. Focusing predominantly on US equities and ETFs, his systematic approach of identifying trend, finding signals within the trend, and setting key price levels has made him an esteemed market technician. Arthur has written articles for numerous financial publications including Barrons and Stocks & Commodities Magazine. In addition to his Chartered Market Technician (CMT) designation, he holds an MBA from the Cass Business School at City University in London.
Learn More