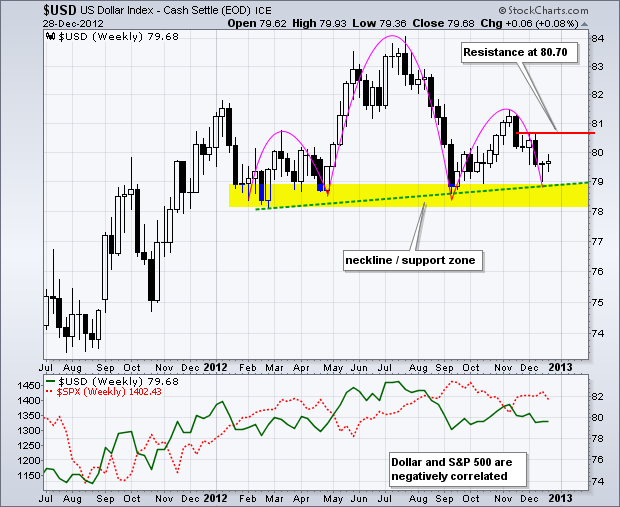
The US Dollar Index ($USD) was all over the place in 2012, but ended the year slightly lower than where it started. The index started the year around 80, surged to 84 and closed at 79.62 on Friday. From February to December, a large head-and-shoulders reversal formed with a rising neckline. Overall, I would use the 2012 lows to mark a support zone in the 78-79 area. A break below this zone would confirm the head-and-shoulders pattern and target further weakness towards the 74 area. Such a move would be bullish for stocks because the Dollar and S&P 500 move in opposite directions. Weakness in the Dollar would suggest a strong appetite for risk, which would bode well for risky assets, such as stocks. A close above the December high would call for a reassessment of this bearish head-and-shoulders pattern.

Click this image for a live chart

Click this image for a live chart

About the author:
Arthur Hill, CMT, is the Chief Technical Strategist at TrendInvestorPro.com. Focusing predominantly on US equities and ETFs, his systematic approach of identifying trend, finding signals within the trend, and setting key price levels has made him an esteemed market technician. Arthur has written articles for numerous financial publications including Barrons and Stocks & Commodities Magazine. In addition to his Chartered Market Technician (CMT) designation, he holds an MBA from the Cass Business School at City University in London.
Learn More