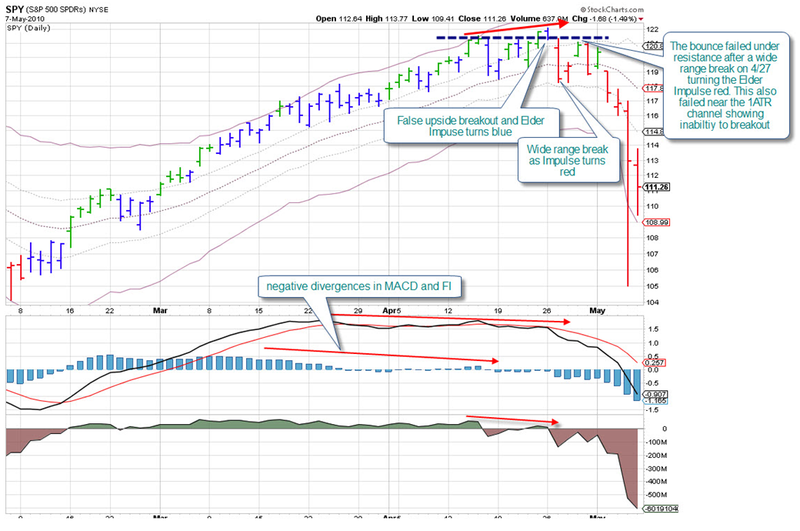
Alexander Elder and his partner Kerry Lovvorn put together this chart analysis of last week's market action:

Click here for a live version of this chart.
The chart uses our new version of Dr. Elder's Impulse Trading System to color the bars. "FI" refers to the "Force Index" which is the lowest indicator on the chart. You can see more of their work at SpikeTrade.com.

About the author:
Chip Anderson is the founder and president of StockCharts.com.
He founded the company after working as a Windows developer and corporate consultant at Microsoft from 1987 to 1997.
Since 1999, Chip has guided the growth and development of StockCharts.com into a trusted financial enterprise and highly-valued resource in the industry.
In this blog, Chip shares his tips and tricks on how to maximize the tools and resources available at StockCharts.com, and provides updates about new features or additions to the site.
Learn More