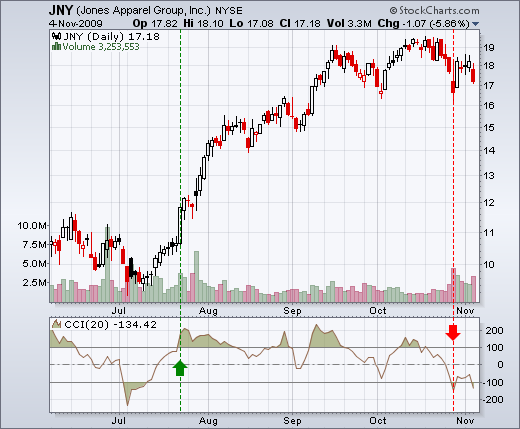
On the Stockcharts.com scan page for Wednesday evening, there were 20 CCI sell signals among NYSE stocks. A CCI sell signal occurs with a plunge below -100. Conversely, a CCI buy signal triggers with a surge above +100. CCI for Jones Apparel (JNY) surged above +100 on July 23rd and plunged below -100 on October 28th, four months later. There was a second dip below -100 on Wednesday to affirm the sell signal.

About the author:
Arthur Hill, CMT, is the Chief Technical Strategist at TrendInvestorPro.com. Focusing predominantly on US equities and ETFs, his systematic approach of identifying trend, finding signals within the trend, and setting key price levels has made him an esteemed market technician. Arthur has written articles for numerous financial publications including Barrons and Stocks & Commodities Magazine. In addition to his Chartered Market Technician (CMT) designation, he holds an MBA from the Cass Business School at City University in London.
Learn More
