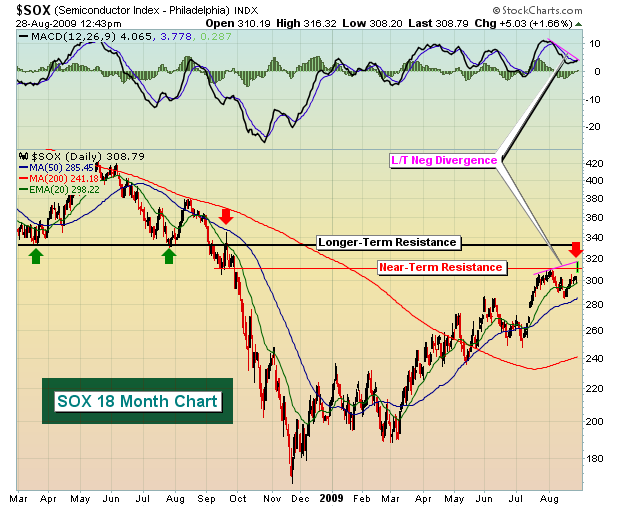
Once the SOX broke below the March and July lows of 2008, a new low close of 312 was established in mid-Sept 2008. After a move higher to quickly retest the earlier breakdown area, the SOX fell precipitously into late 2008. After months of trending higher, the SOX had climbed within a whisker of the 312 resistance area. On Friday morning, Intel (INTC) provided the catalyst to test this key area. The SOX opened at 311, just beneath support, then rallied to an intraday breakout at 316. At mid-day Friday, the breakout attempt had failed. The SOX had fallen back to 310. We'll need to see where the SOX finishes, but clearly a move above 312 on heavy volume would be bullish - the further above 312 the better. A failure at 312 is significant for a couple of reasons. First, heavy volume reversals generally put a halt to trends, especially in the short-term. Second, the long-term negative divergence on the MACD is evident. As prices have risen to new highs on the SOX, the MACD has barely budged higher. This is an indication of waning momentum on the part of the longs. Again, a close above 312 and we've got a totally different ballgame. Until then, however, you might consider lightening the load when it comes to semiconductors - at least until the breakout is confirmed.

