(
Click here for a live version of this chart.)
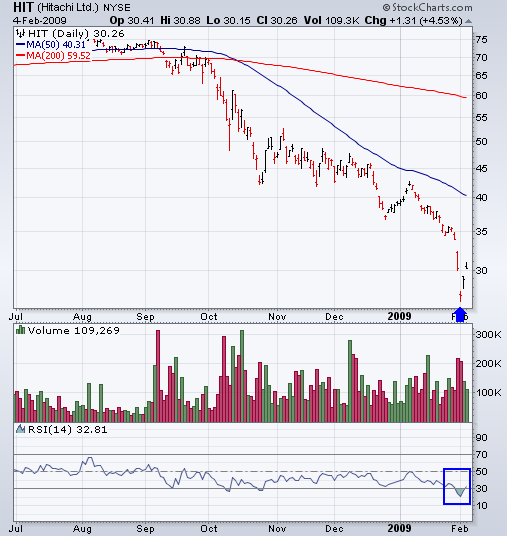
Hitachi's RSI indicator moved back above 30 today after sinking down around 20 two days ago. This big jump indicates that an important rebound is underway and has a good chance of continuing at least until the RSI crosses 50 again. The price action shows what may be a selling climax follow by a strong 2-day rally. This is worth watching closely.

About the author:
Chip Anderson is the founder and president of StockCharts.com.
He founded the company after working as a Windows developer and corporate consultant at Microsoft from 1987 to 1997.
Since 1999, Chip has guided the growth and development of StockCharts.com into a trusted financial enterprise and highly-valued resource in the industry.
In this blog, Chip shares his tips and tricks on how to maximize the tools and resources available at StockCharts.com, and provides updates about new features or additions to the site.
Learn More
