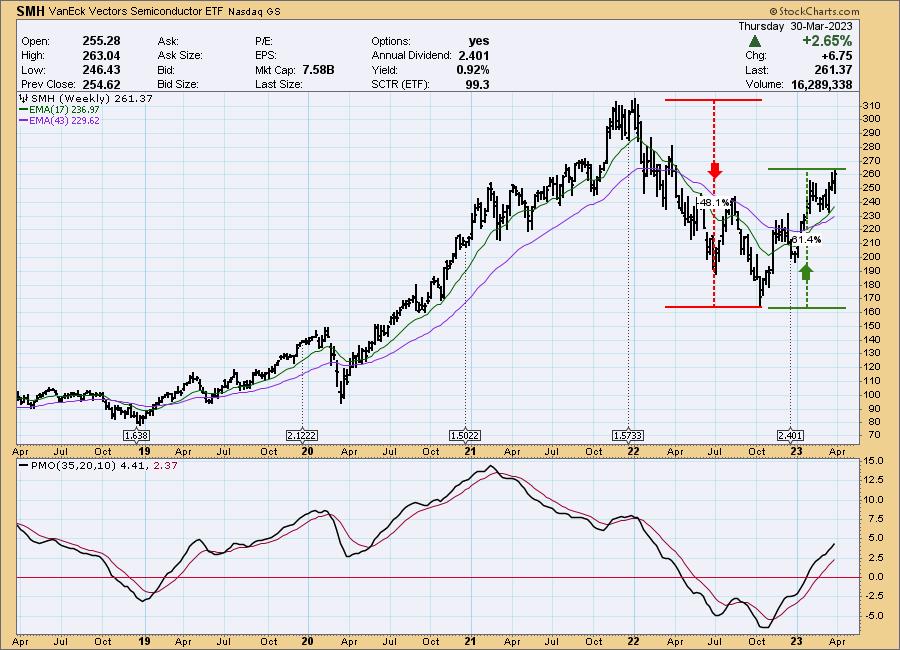
After a bear market decline of nearly -50%, the Semiconductor ETF (SMH) has rallied over +60% out of the October low. The long-term picture still looks promising, with the weekly PMO rising steeply above the zero line. But let's look in a shorter-term timeframe to see if there any more immediate problems.

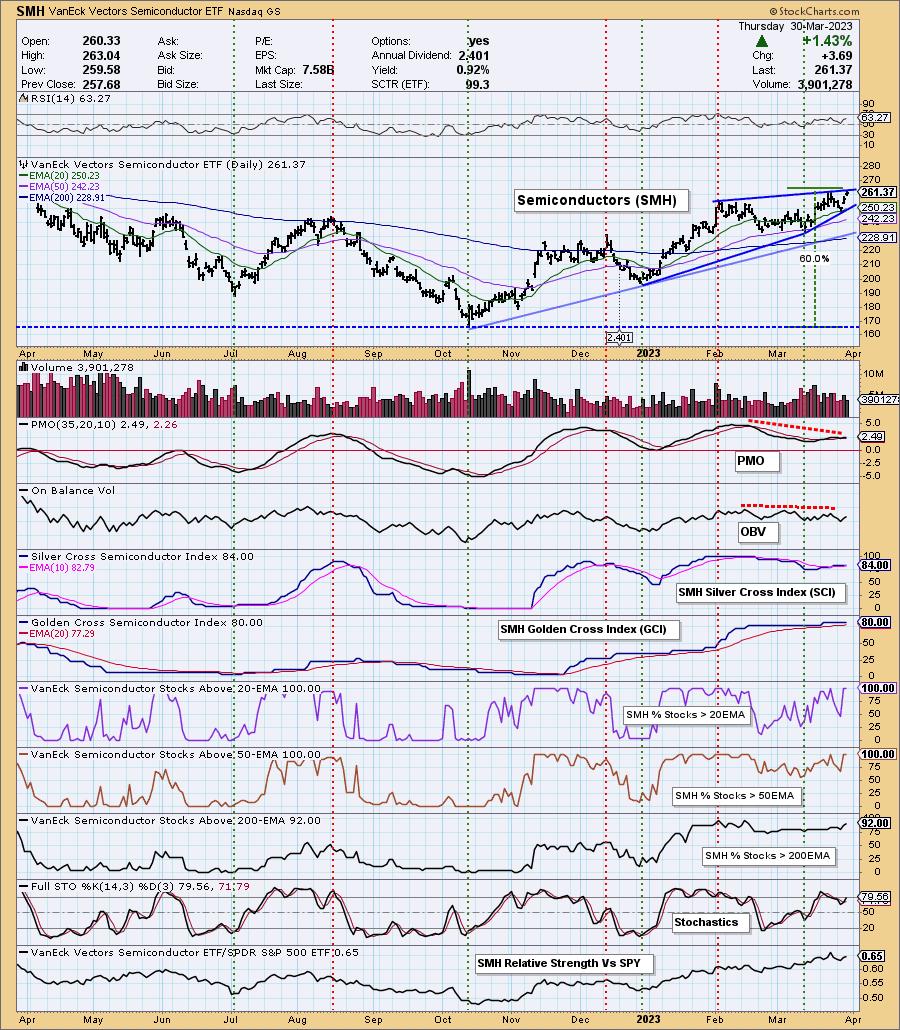
This one-year daily chart helps us look more closely at the current technical conditions.
- To begin, price is hitting the top of a bearish rising wedge pattern.
- The rising trend lines from the October low have become more accelerated, making the advance parabolic and subject to a sharp correction.
- The PMO and OBV have bearish negative divergences -- they are falling while price is making new 50-week highs.
- The Silver Cross Index shows that 84% of component SMH stocks have the 20EMA above the 50EMA, which is very bullish.
- The Golden Cross Index shows that 80% of SMH component stocks have the 50EMA above the 200EMA; again, very bullish.
- The Percent of Stocks Above the 20EMA and 50EMA is at 100%. This is as good as it gets, and presents vulnerability to a pullback.

Conclusion: SMH is showing a parabolic advance, as well as some negative divergences. Participation is excellent, but it is as good as it gets, which typically results in participation abating somewhat. In my opinion, SMH is setting up for a correction, but this does not rule out a final upside blow-off to cap the parabolic move. Now is not a good time to open new positions; rather, it is a good time to tighten stops.
Watch the latest episode of DecisionPoint on StockCharts TV's YouTube channel here!
Technical Analysis is a windsock, not a crystal ball. --Carl Swenlin
(c) Copyright 2023 DecisionPoint.com
Helpful DecisionPoint Links:
DecisionPoint Alert Chart List
DecisionPoint Golden Cross/Silver Cross Index Chart List
DecisionPoint Sector Chart List
Price Momentum Oscillator (PMO)
Swenlin Trading Oscillators (STO-B and STO-V)
DecisionPoint is not a registered investment advisor. Investment and trading decisions are solely your responsibility. DecisionPoint newsletters, blogs or website materials should NOT be interpreted as a recommendation or solicitation to buy or sell any security or to take any specific action.

