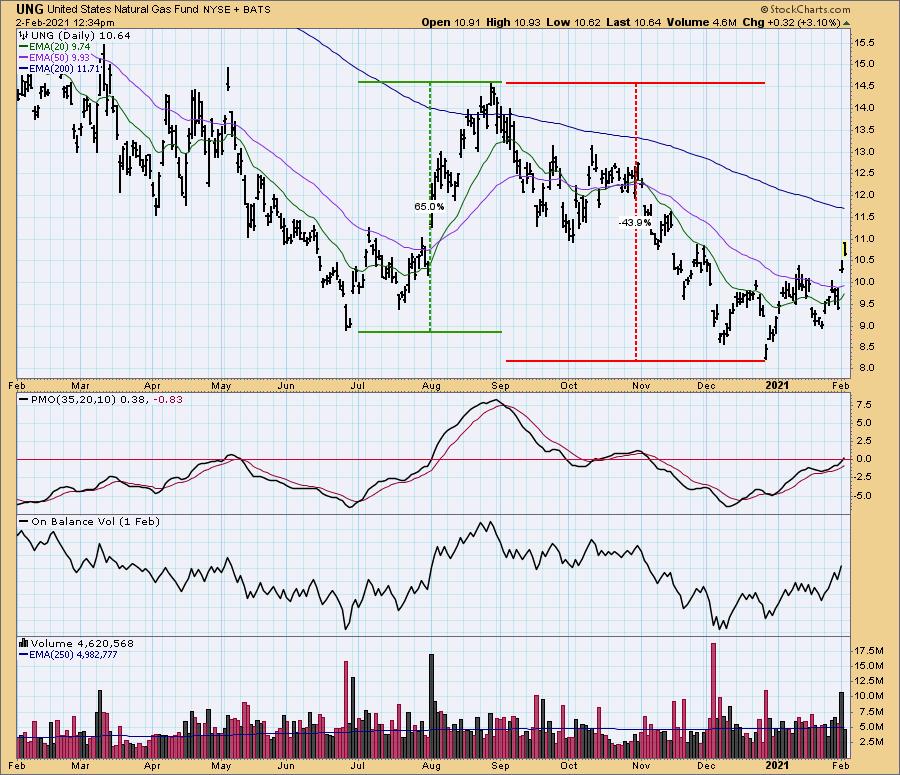
I have been watching the Natural Gas ETF (UNG) as a potential trading vehicle for about a year. My attention is focused on the long side, but opportunities of that nature have been limited. There was a rally of +65% last summer, but that reversed in August, going into a new low in December. With the new administration being extremely hostile to fossil fuels, the potential for reduced supply is giving UNG a boost.


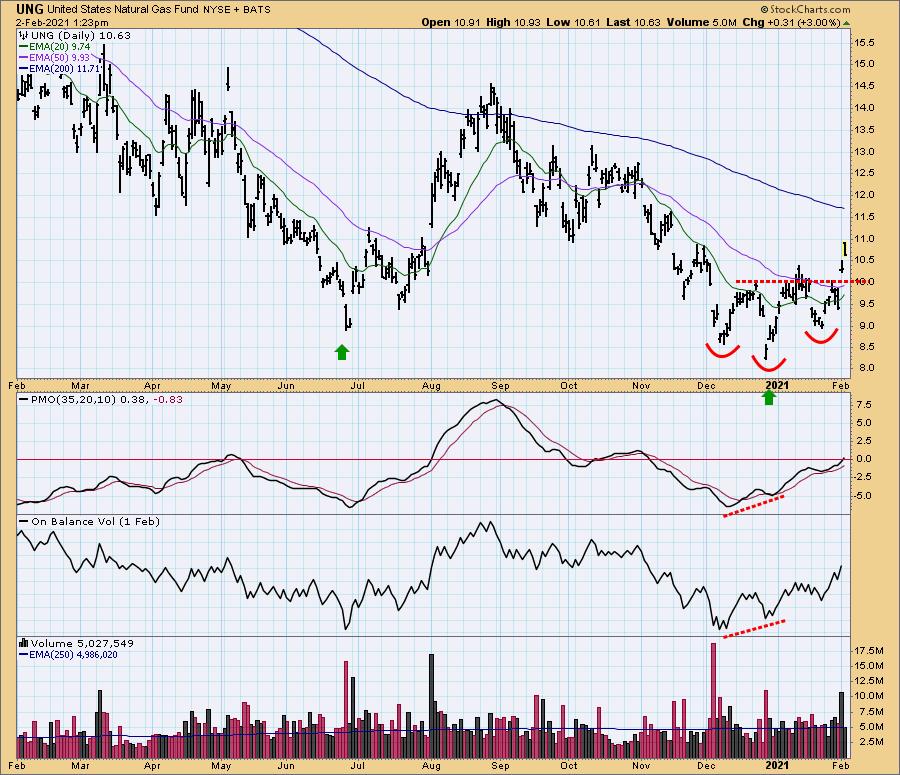
Technically speaking, a promising triple bottom has executed into a breakout. Note the prescient positive divergences on OBV and the PMO, formed as UNG was making its new low in December. Another interesting feature of this chart is the longer-term potential double bottom between the June and December lows. We need to view this in broader context.


Click here to register in advance for the recurring free DecisionPoint Trading Room! Recordings are available!
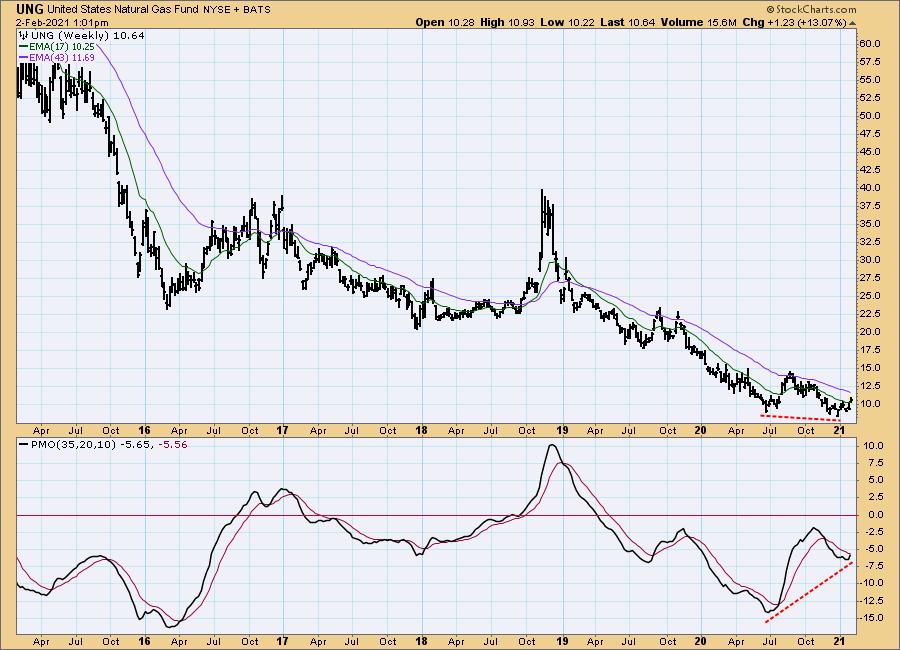
Looking at a weekly chart, I'd say that the June/December double bottom is very promising. The price pattern is well-formed, and the weekly PMO has formed a positive divergence and is rising.

CONCLUSION: The fundamentals and the technicals are currently aligned nicely in favor of an extended rally in UNG. Please note that this is an opinion, not a recommendation.
Technical Analysis is a windsock, not a crystal ball.
Helpful DecisionPoint Links:
DecisionPoint Alert Chart List
DecisionPoint Golden Cross/Silver Cross Index Chart List
DecisionPoint Sector Chart List
Price Momentum Oscillator (PMO)
Swenlin Trading Oscillators (STO-B and STO-V)
DecisionPoint is not a registered investment advisor. Investment and trading decisions are solely your responsibility. DecisionPoint newsletters, blogs or website materials should NOT be interpreted as a recommendation or solicitation to buy or sell any security or to take any specific action. fe
