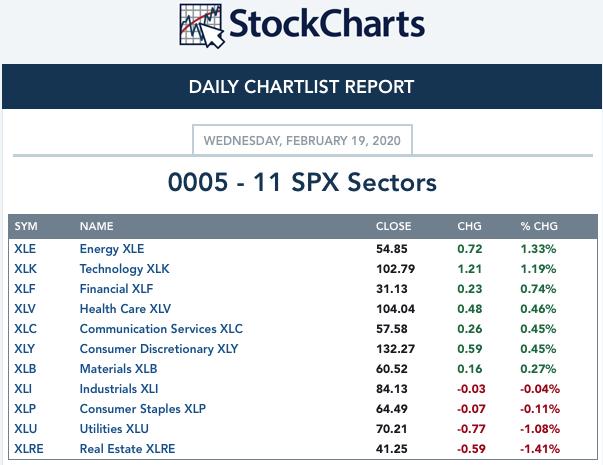
Today Energy (XLE) was the best performing of the eleven SPDR sectors we follow.

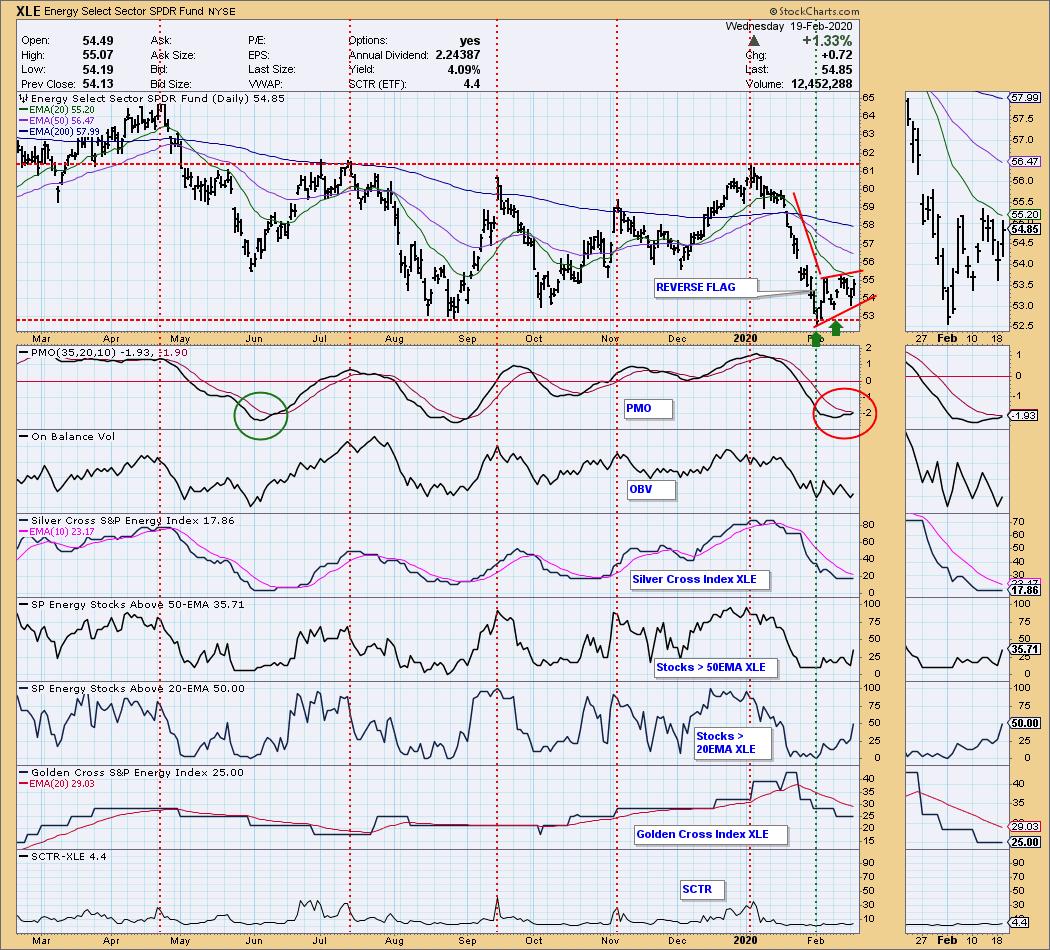
I have been watching the Energy Sector (XLE) for a few weeks, wondering if it was finally setting up for a rally. Price reached the bottom of a nine-month range, and the PMO bottomed, but that PMO bottom looked pretty shallow -- I prefer more decisive turns, such as the one back in July. At the beginning of this month there was a double price bottom, but the rally off the second bottom failed to execute a break out. We use a ton of indicators on the eleven sector charts we follow, but in this case the best we can say is that they are confirming price movement, not giving us useful divergences. Confirmations are really no help.

In the end we are left with basic price pattern analysis, which has been around long before the more sophisticated internal indicators were invented. What is most apparent is the bearish reverse flag formation, the flag portion of which is a rising wedge. In either case the technical expectation is for the formation(s) to resolve downward. So to answer my original question, no, the technicals say that the Energy Sector will probably go lower.

As investors we want to accomplish two basic things: (1) Determine the trend and condition of the market, and (2) select stocks that will ride that tide. The DecisionPoint Alert helps with the first step, and DecisionPoint Diamonds helps with the second. Go to DecisionPoint.com and SUBSCRIBE TODAY! (Charter Subscriber Discounts Available!)
Happy Charting! - Carl
Technical Analysis is a windsock, not a crystal ball.
Helpful DecisionPoint Links:
DecisionPoint Alert Chart List
DecisionPoint Golden Cross/Silver Cross Index Chart List
DecisionPoint Sector Chart List
Price Momentum Oscillator (PMO)
Swenlin Trading Oscillators (STO-B and STO-V)
