
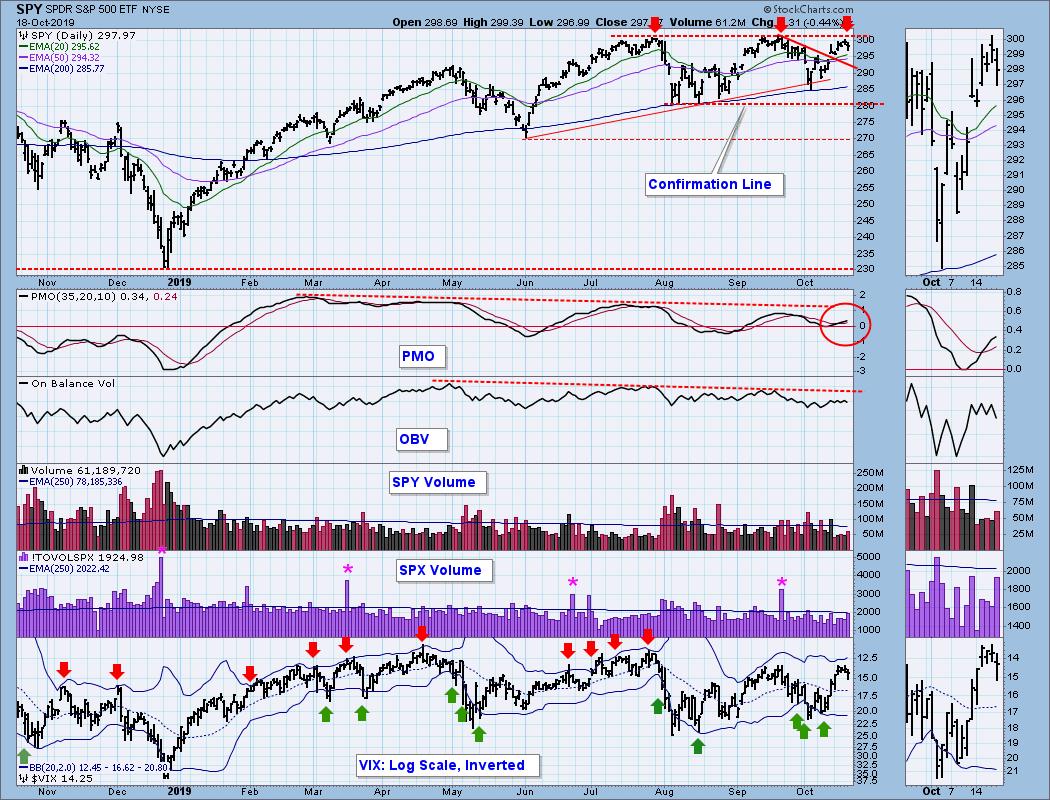
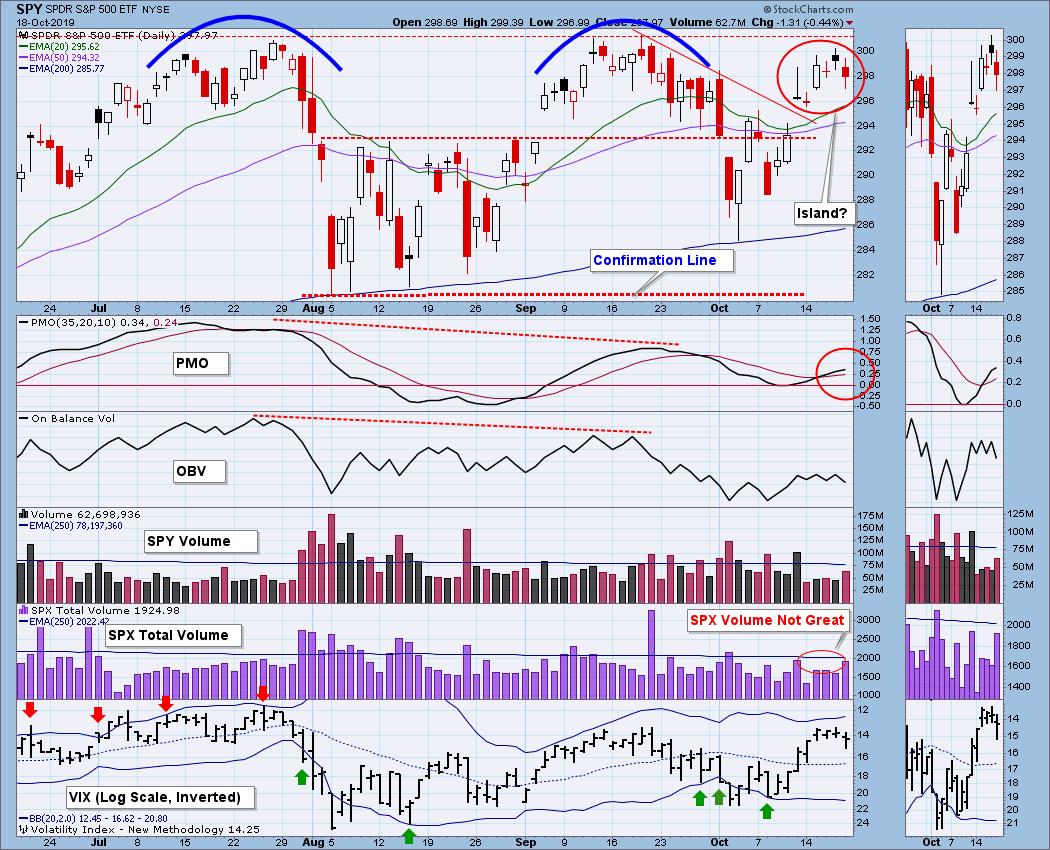
The breakout above the short declining tops line last week was extended upward this week, and that has kind of messed up my double top scenario. Now it appears that a triple top may be in progress, and the expected outcome for that is really no different than for a double top. At this point I don't think that the triple top assessment is as strong as the double top was, but let's look deeper into this in our discussion below.
The DecisionPoint Weekly Wrap presents an end-of-week assessment of the trend and condition of the stock market (S&P 500), the U.S. Dollar, Gold, Crude Oil, and Bonds.
Watch the latest episode of DecisionPoint on StockCharts TV's YouTube channel here!
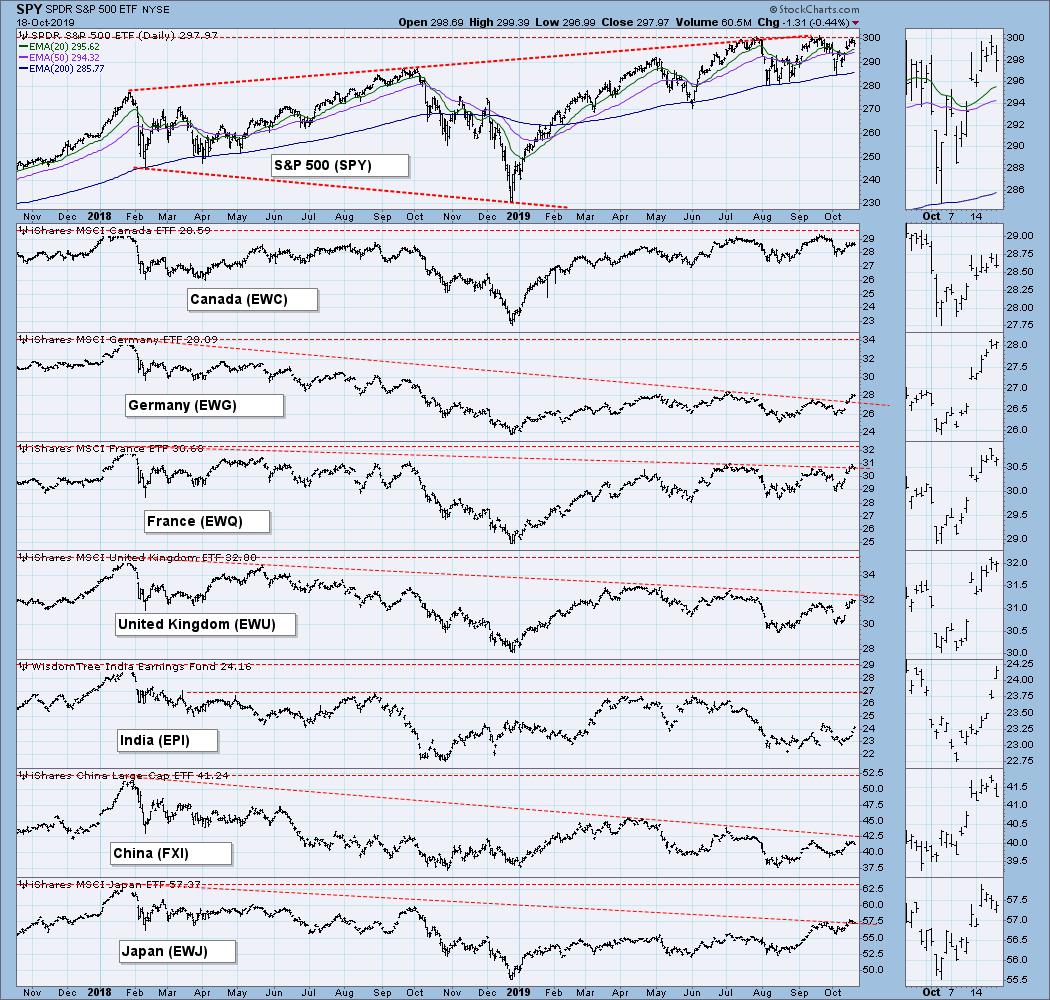
GLOBAL MARKETS
The U.S. market is the clear leader, with only Canada in a close second.
BROAD MARKET INDEXES
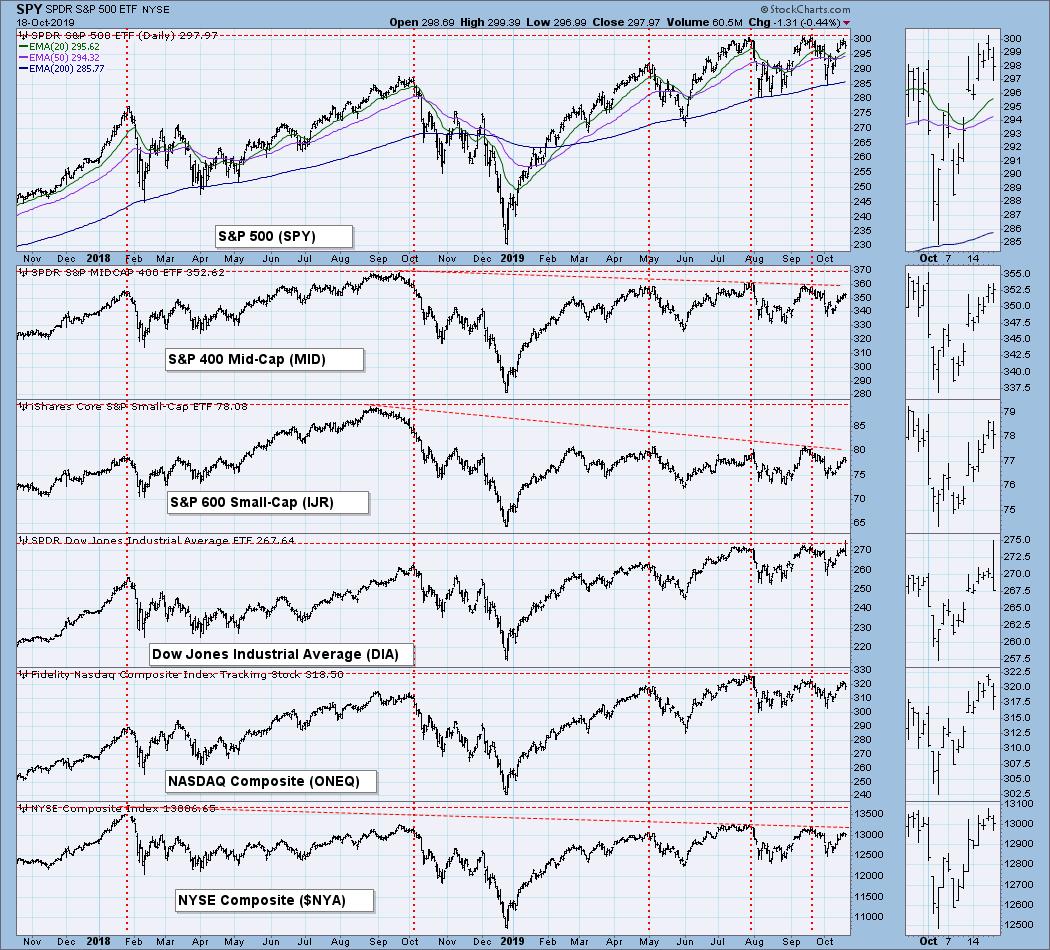
The large-cap S&P 500 still leads. The chart shows that DIA made a new, all-time high on Friday. That was just one of those weird things that ETFs do on rare occasions. It was a weird intraday data point that is apparently legitimate, but the actual Dow Industrials ($INDU) didn't make the new high.
SECTORS
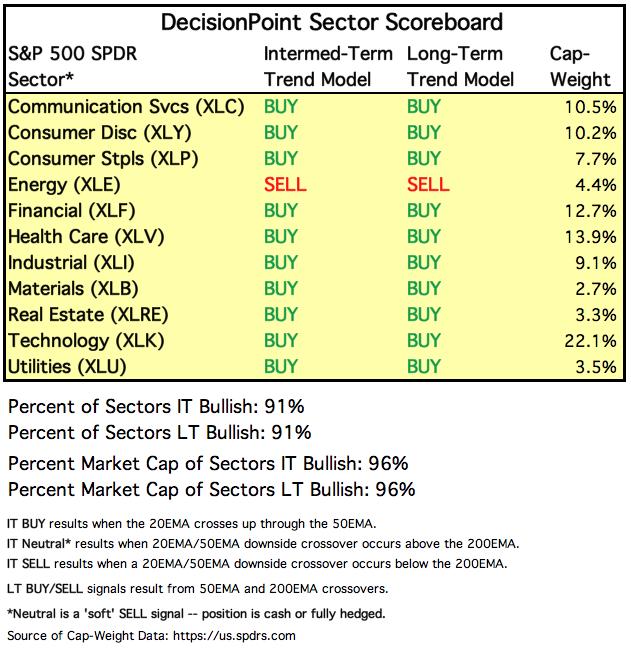
Each S&P 500 Index component stock is assigned to one, and only one, of 11 major sectors. This is a snapshot of the Intermediate-Term and Long-Term Trend Model signal status for those sectors.
INTEREST RATES
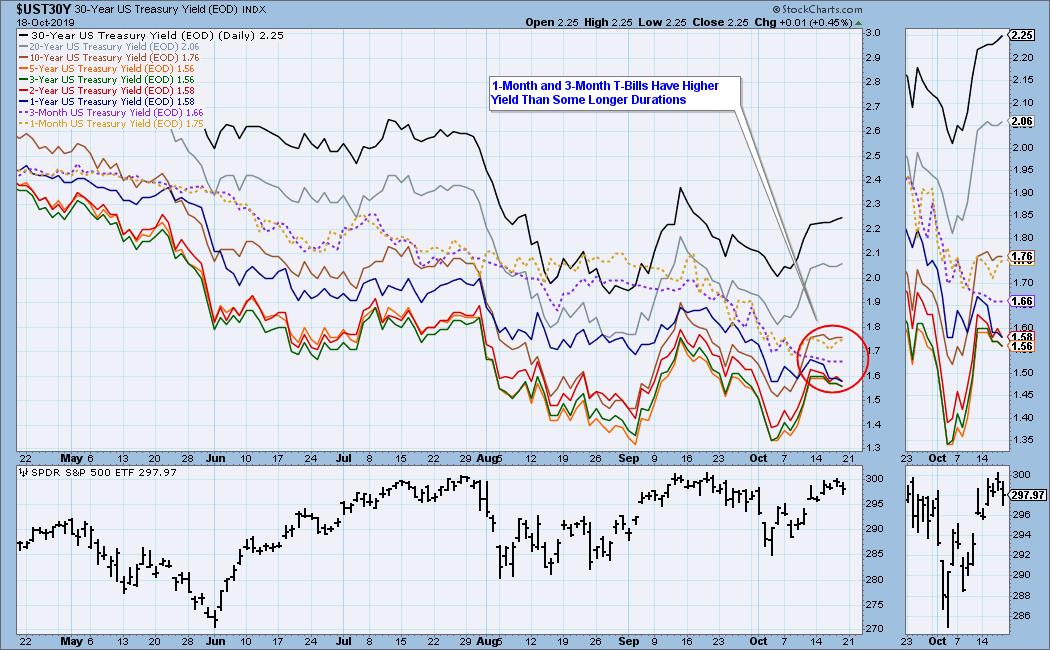
I will be including a chart so we can monitor rate inversions. In normal circumstances the longer money is borrowed the higher the interest rate that must be paid. When rates are inverted, the reverse is true. On the chart below, notice that the one-month and three month T-Bills (dotted lines) pay a higher interest rate than some longer duration bonds.
STOCKS
IT Trend Model: NEUTRAL as of 9/6/2019
LT Trend Model: BUY as of 2/26/2019
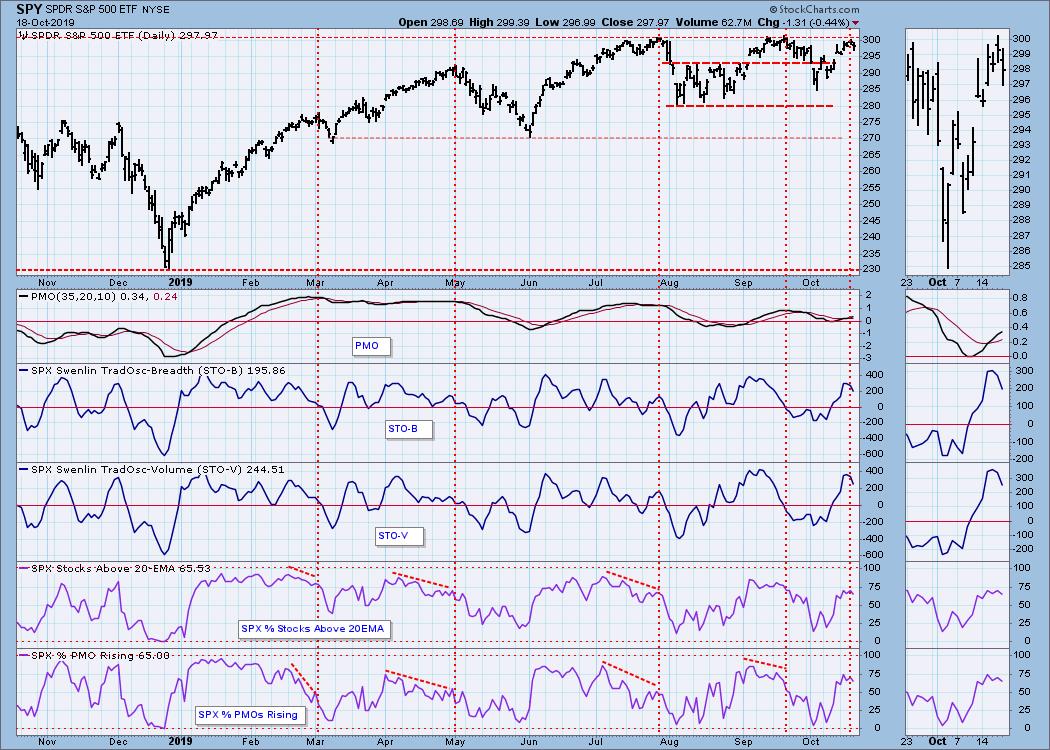
SPY Daily Chart: The triple top concept looks less compelling when we zoom in on the chart. It is still not out of the question, but I'm more intrigued by the potential for an island reversal. SPX volume this week was light, indicating a lack of conviction. Yes, Friday's volume was decent, but that was most likely because of options expiration.
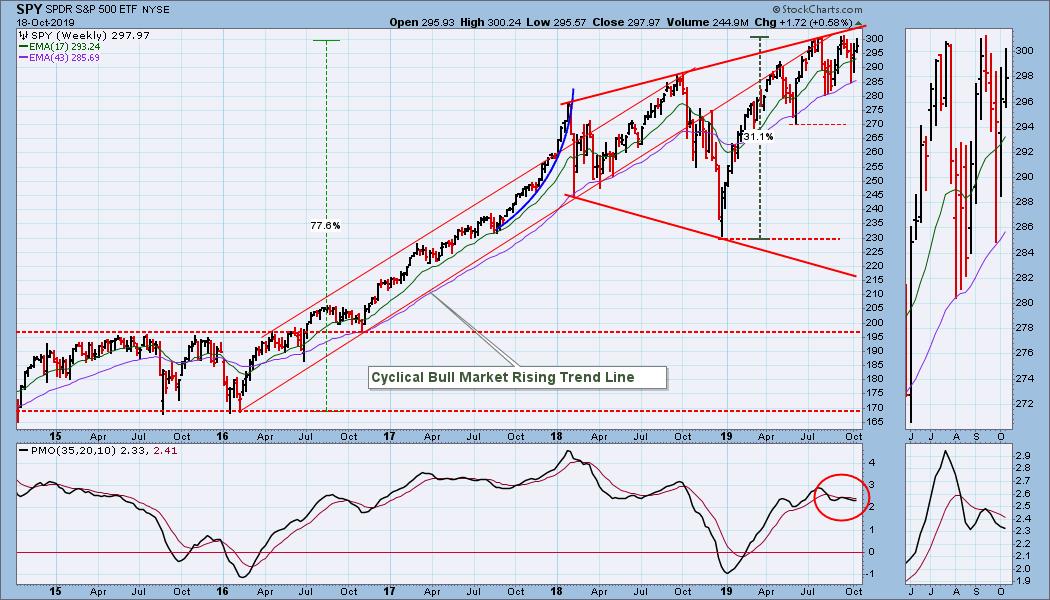
SPY Weekly Chart: It was another week with small gains -- just over one-half a percent.
Climactic Market Indicators: There was not much in the way of climactic action this week. And the VIX topped near overbought levels.
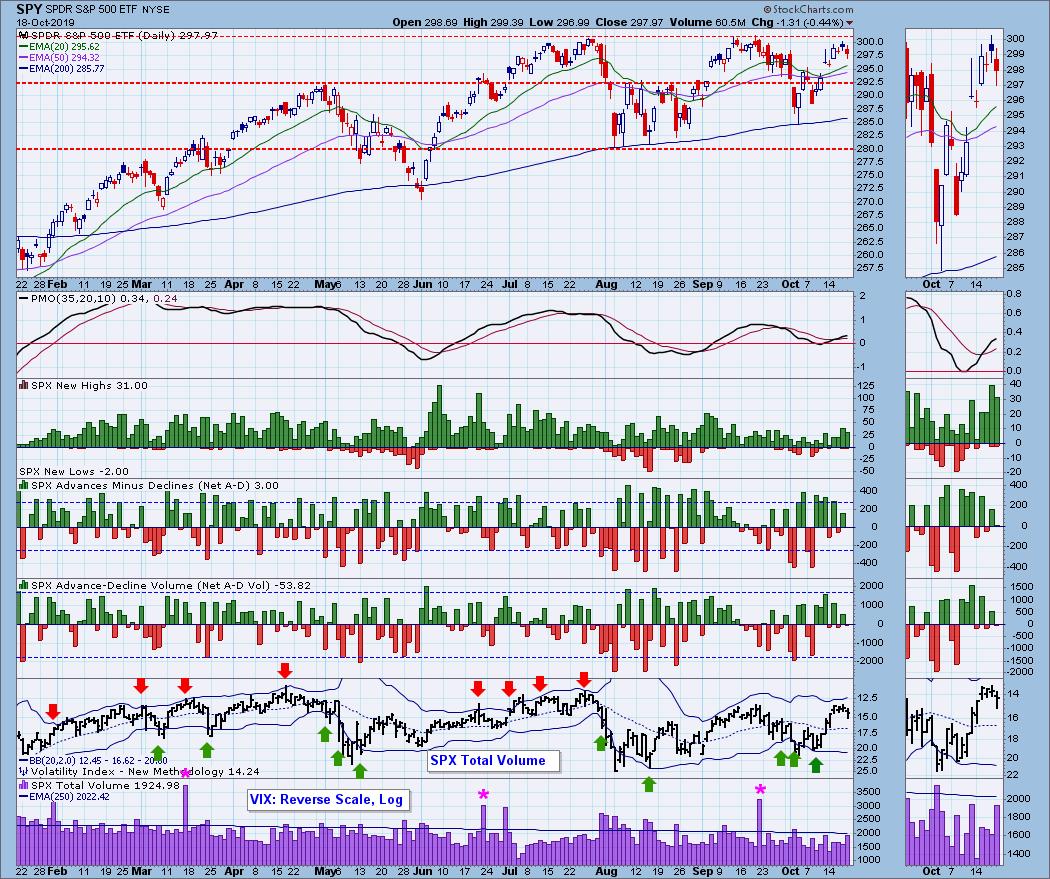
Short-Term Market Indicators: Even though price was within 0.29% of all-time highs, a ll these indicators turned over at lower levels than at the market top last month. Internals are weaker.
Intermediate-Term Market Indicators: The PMO, ITBM, ITVM, and Silver Cross Index all bottomed last week, and they crossed their signal lines this week. They are still well below the top of their range, and will accommodate a solid price advance before they become overbought; however, the negative view is that the PMO and Silver Cross Index have formed negative divergences over a seven-month period, and the ITBM and ITVM have formed reverse divergences.
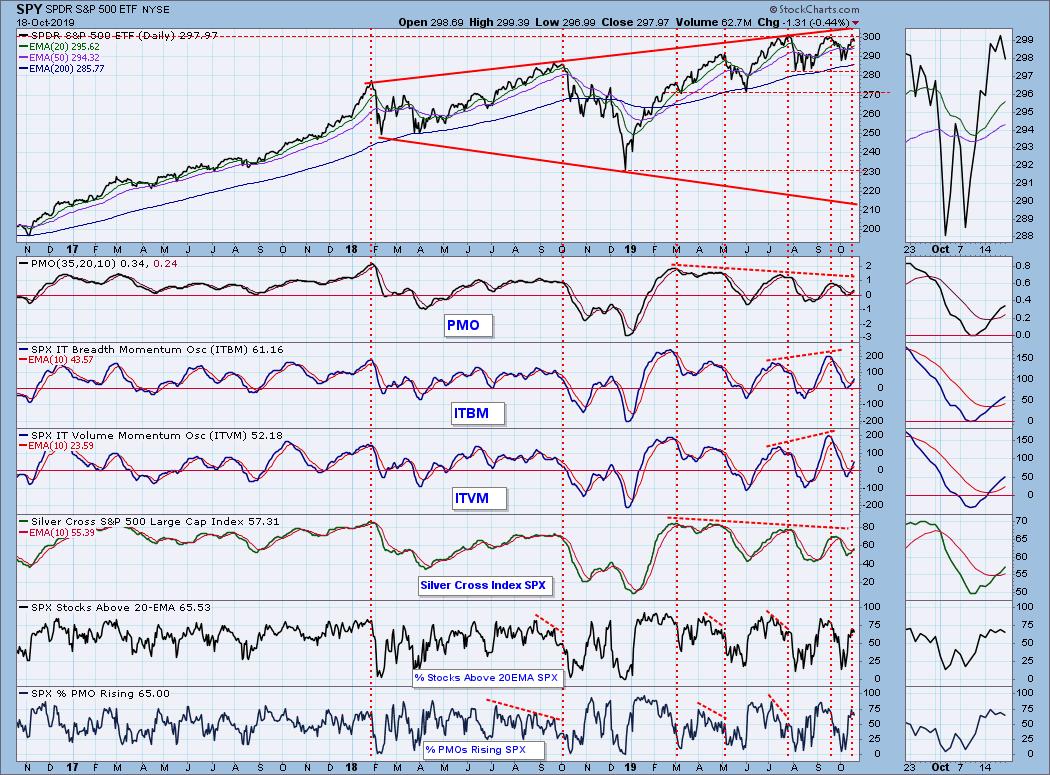
CONCLUSION: The market turned down near overhead resistance, short-term indicators topped at overbought levels, and there is the potential for an island reversal, so I think the market is vulnerable for a decline in the short-term. If that happens, the intermediate-term indicators, which currently imply a favorable outcome, will probably top and head lower, thereby turning the outlook in that time frame bearish. Obviously, there are many other possible outcomes, but this is what I'll be looking for.
As for the double/triple top issue, the current chart doesn't present a textbook example of either one; however, I think the concept will be useful for making downside projections if the market does head lower.
DOLLAR (UUP)
IT Trend Model: BUY as of 7/5/2019
LT Trend Model: BUY as of 5/25/2018
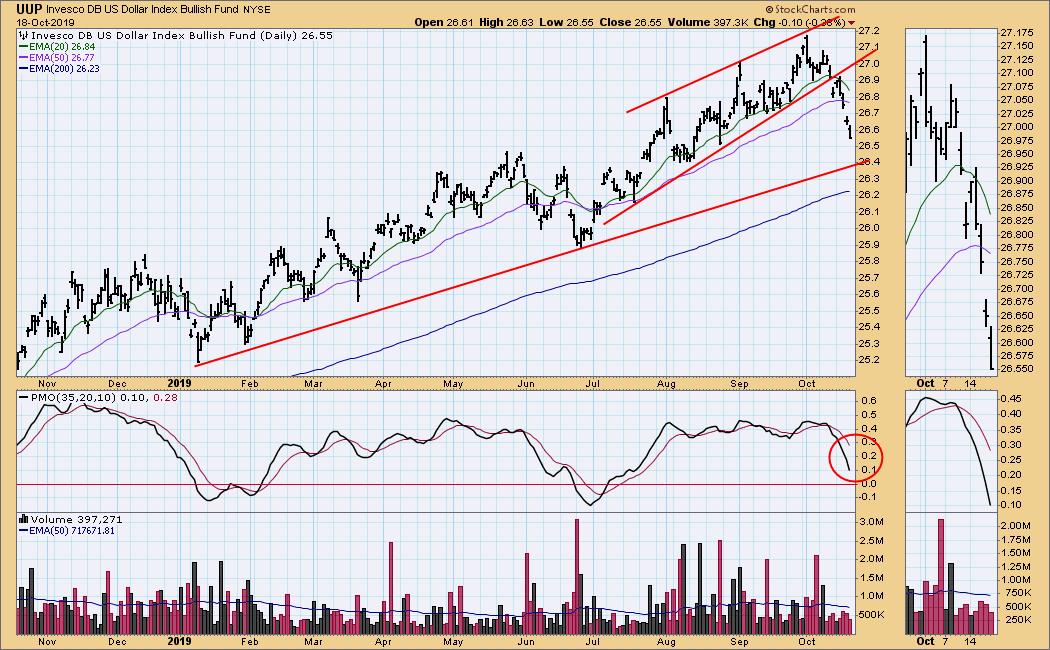
UUP Daily Chart: A rising wedge formation is technically expected to resolve downward, and in this case expectations were fulfilled.
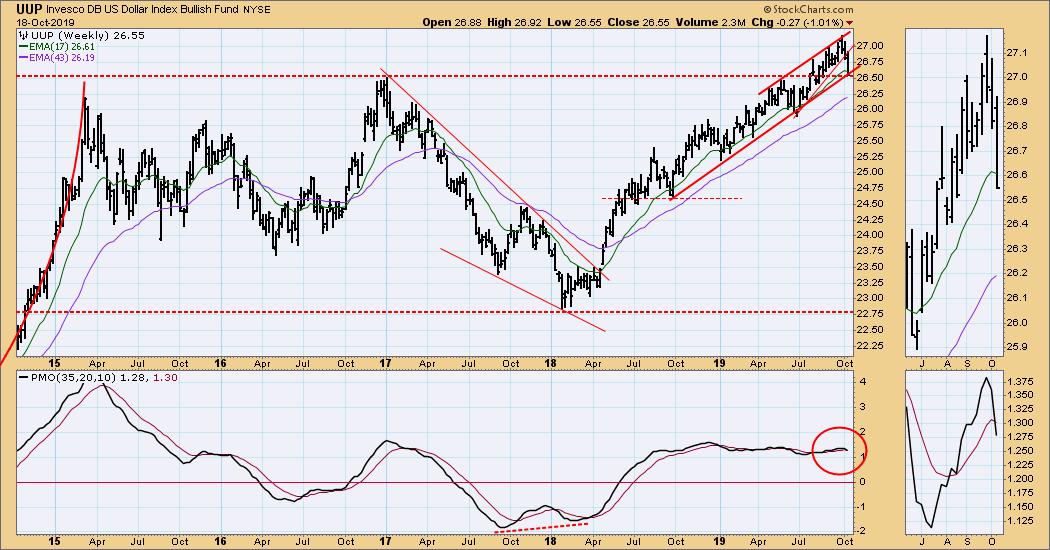
UUP Weekly Chart: In this time frame we get a much better perspective, as we can see that price has pulled back to a rising trend line, and, more importantly, long-term support. This is, of course bullish, but the next thing we want to see is a bounce off the support.
GOLD
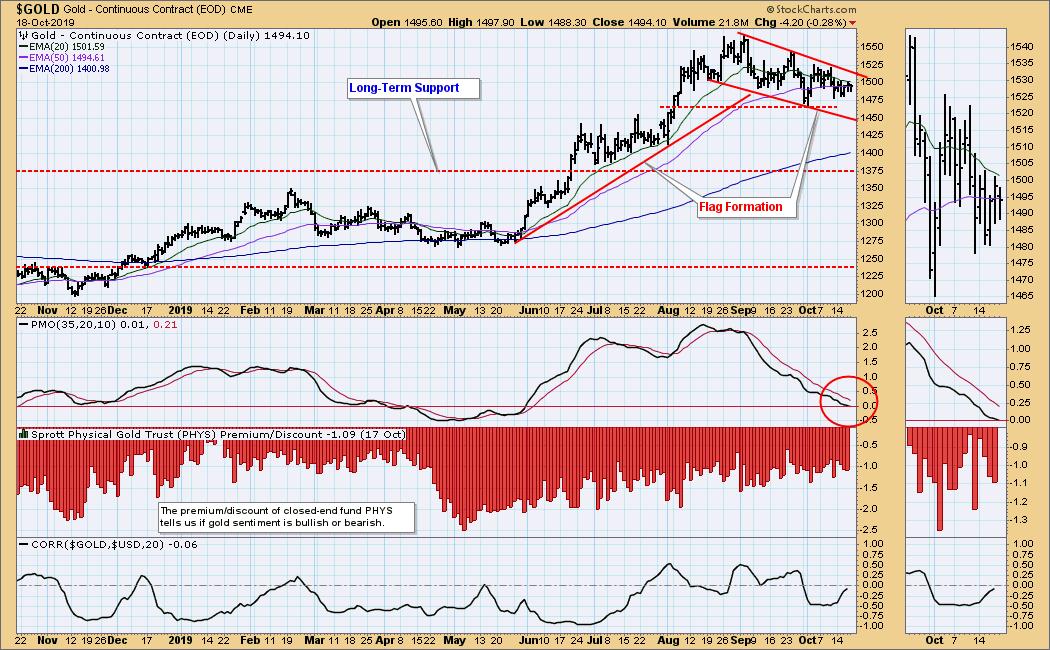
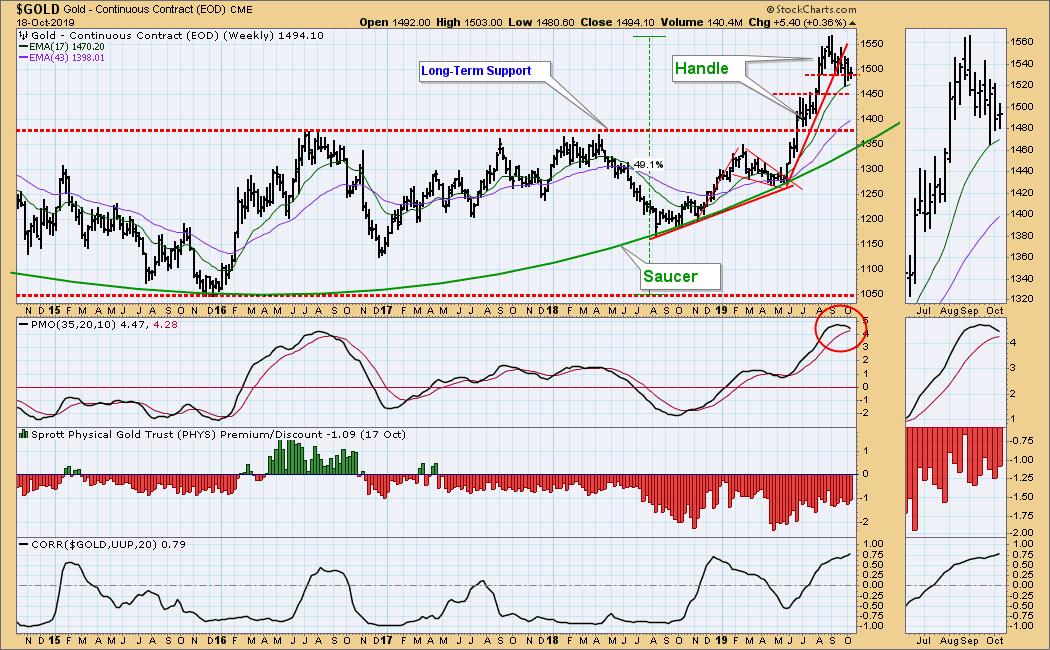
IT Trend Model: BUY as of 6/3/2019
LT Trend Model: BUY as of 1/8/2019
GOLD Daily Chart: Bullish. I am interpreting the rising trend line as a flag pole, and the orderly pullback as a flag.
GOLD Weekly Chart: This longer-term picture emphasizes the bullish saucer with handle structure. What I can't show on the chart is that the Commercials (the guys who are usually right) are heavily short gold. A pullback to work off the shorts would fit in with making a more prominent handle before gold continues to rally. Or the shorts could get caught in a short-covering rally. At any rate, I remain bullish on gold.
CRUDE OIL (USO)
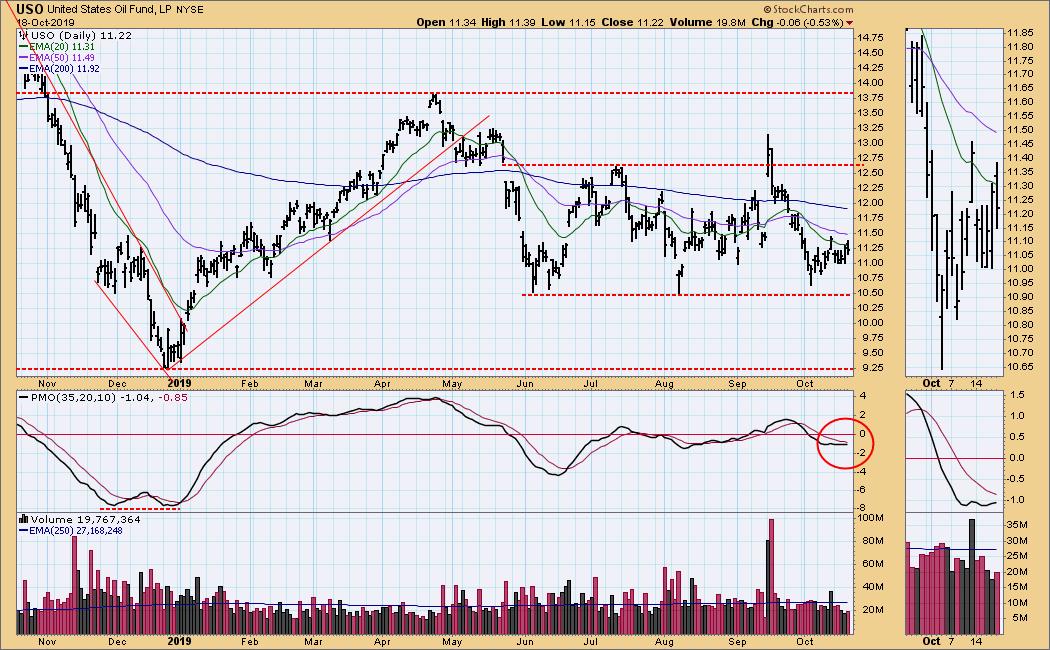
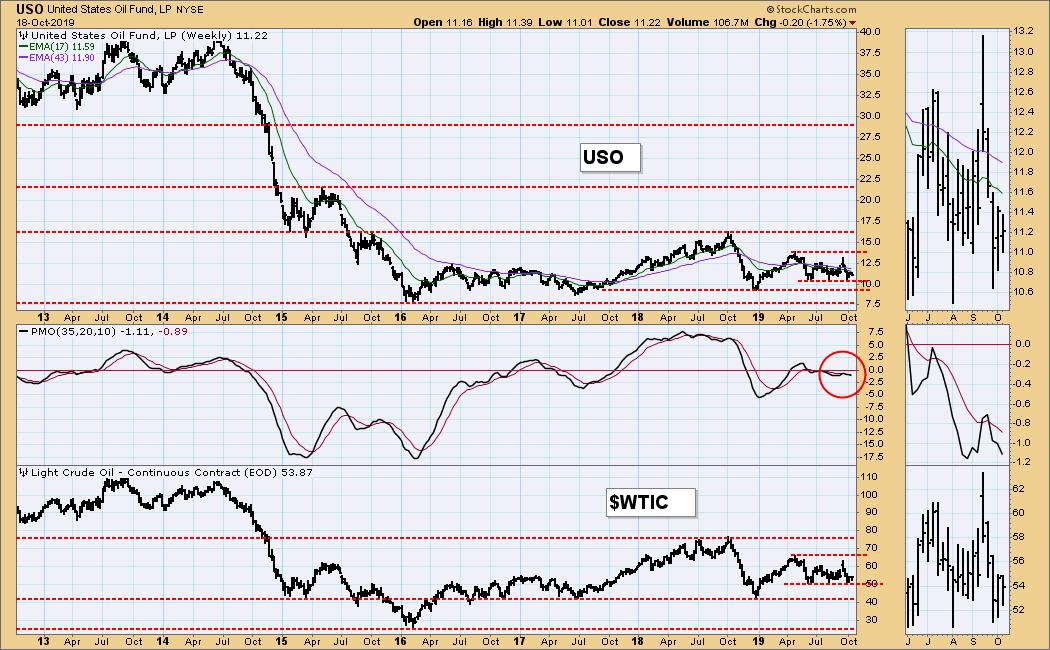
IT Trend Model: SELL as of 10/2/2019
LT Trend Model: SELL as of 6/4/2019
USO Daily Chart: USO has been maintaining a trading range between 10.50 and 12.65 since June, which is in the middle of the wider range market by the December 2018 low and the April high. My feeling is that price will eventually be testing the low end of the ranges as it drifts lower.
USO Weekly Chart: Presently, price seems pretty well balanced, but, again, I suspect it will drift lower.
BONDS (TLT)
IT Trend Model: BUY as of 12/6/2018
LT Trend Model: BUY as of 1/2/2019
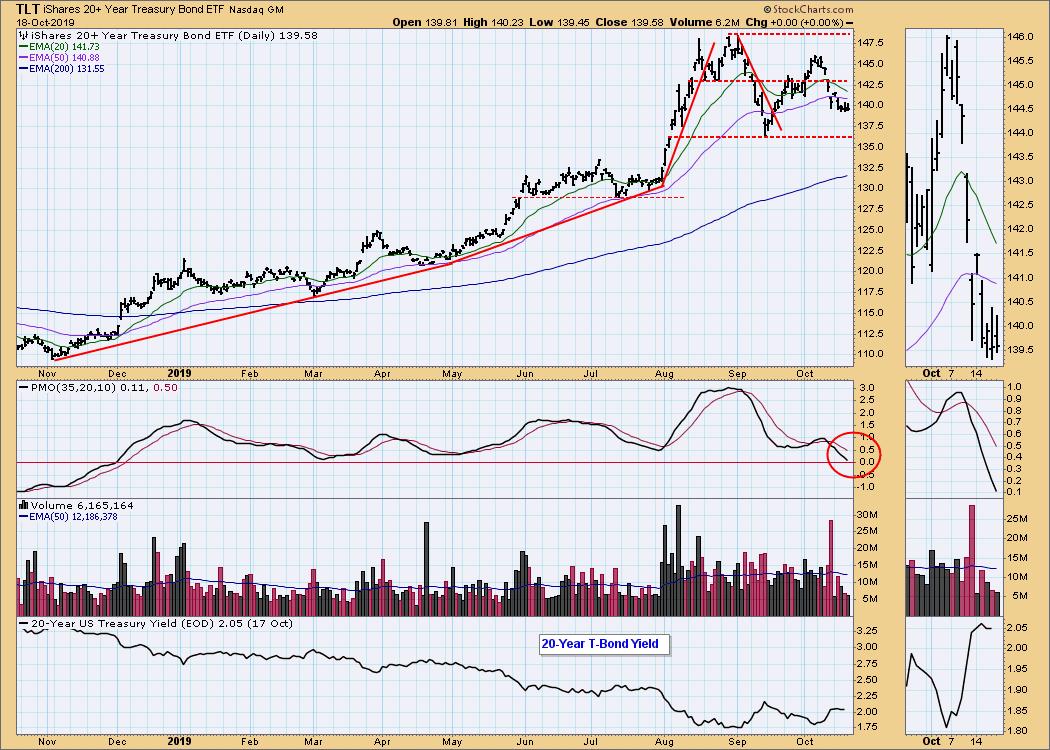
TLT Daily Chart: On Monday price bounced off last week's low, then it came down and retested the support the rest of the week.
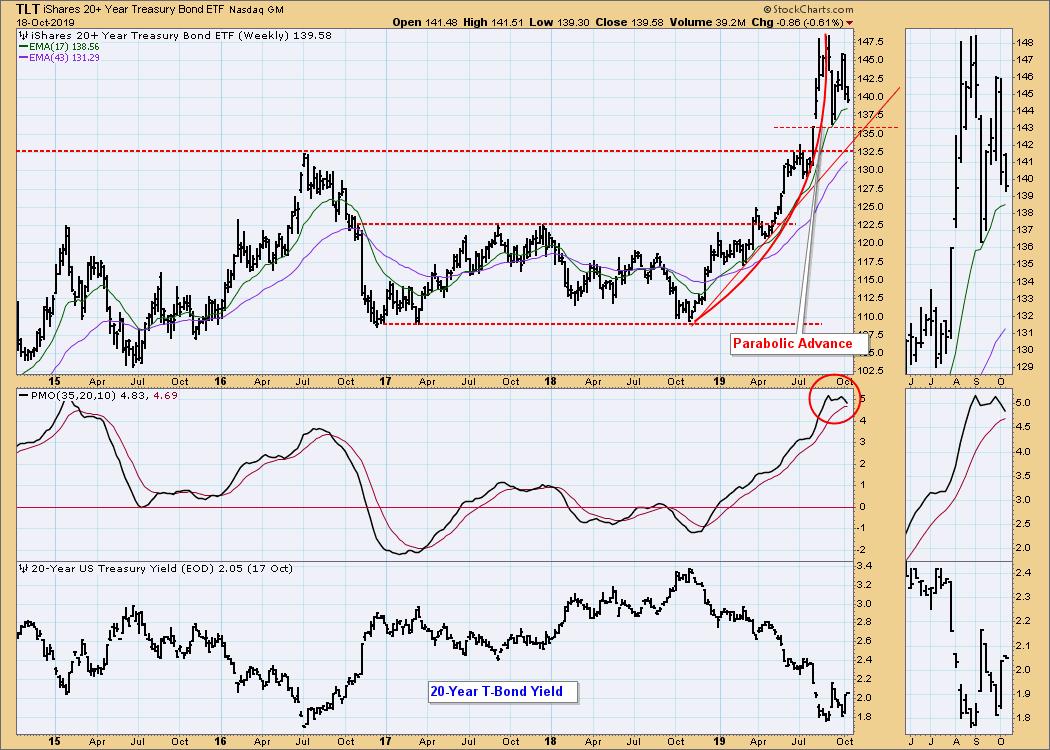
TLT Weekly Chart: Parabolic and/or vertical advances have a tendency to crash badly, but in this case price just needed to break the parabolic and consolidate. Best support is at 132.50.
**Don't miss any of the DecisionPoint commentaries! Go to the "Notify Me" box toward the end of this blog page to be notified as soon as they are published.**
Technical Analysis is a windsock, not a crystal ball.
Happy Charting! - Carl
NOTE: The signal status reported herein is based upon mechanical trading model signals, specifically, the DecisionPoint Trend Model. They define the implied bias of the price index based upon moving average relationships, but they do not necessarily call for a specific action. They are information flags that should prompt chart review. Further, they do not call for continuous buying or selling during the life of the signal. For example, a BUY signal will probably (but not necessarily) return the best results if action is taken soon after the signal is generated. Additional opportunities for buying may be found as price zigzags higher, but the trader must look for optimum entry points. Conversely, exit points to preserve gains (or minimize losses) may be evident before the model mechanically closes the signal.
Helpful DecisionPoint Links:
DecisionPoint Shared ChartList and DecisionPoint Chart Gallery
Price Momentum Oscillator (PMO)
Swenlin Trading Oscillators (STO-B and STO-V)
