

Today, I had a plethora of results from my DP Diamond Scan - 83, to be exact! So it took me a bit longer to find today's diamonds, as I studied not only the daily and weekly charts but also seasonality in order to pare down to the best looking "diamonds in the rough." Enjoy!
Don't miss the latest DecisionPoint StockCharts TV episode with Carl and Erin. Find it on the DecisionPoint playlist on the StockCharts YouTube channel.
Welcome to "DecisionPoint Daily Diamonds," a newsletter in which we highlight five "diamonds in the rough" taken from the results of one of my DecisionPoint scans. Remember, these are not recommendations to buy or sell, but simply stocks that I found interesting. The objective is to save you the work of the initial, tedious culling process, but you need to apply your own analysis and to see if these stocks pique your interest. There are no guaranteed winners here.
Current Market Outlook:
Market Trend: Currently we have Short-Term Trend Model BUY signals on the DP Scoreboard Indexes.
Market Condition: The market is overbought. Weak internals with Price Momentum Oscillator SELL Signals on DP Scoreboard Indexes in IT and LT. Below are the current DP Scoreboards.
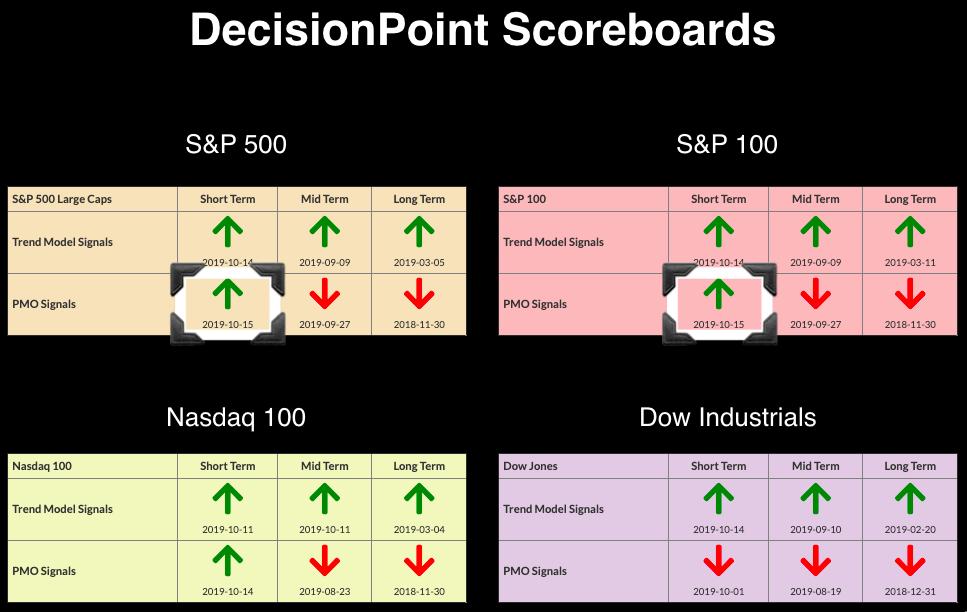
Market Environment: It is important to consider the "odds" for success. Here are the current percentages on the Silver and Golden Cross Indexes:
- Silver Cross: 52.8% SPX ITTM Buy Signals (20-EMA > 50-EMA)
- Golden Cross: 64.2% SPX LTTM Buy Signals (50-EMA > 200-EMA)
Diamond Index:
- Diamond Scan Results: 83
- Diamond Dog Scan Results: 3
- Diamond Bull/Bear Ratio: 27.6
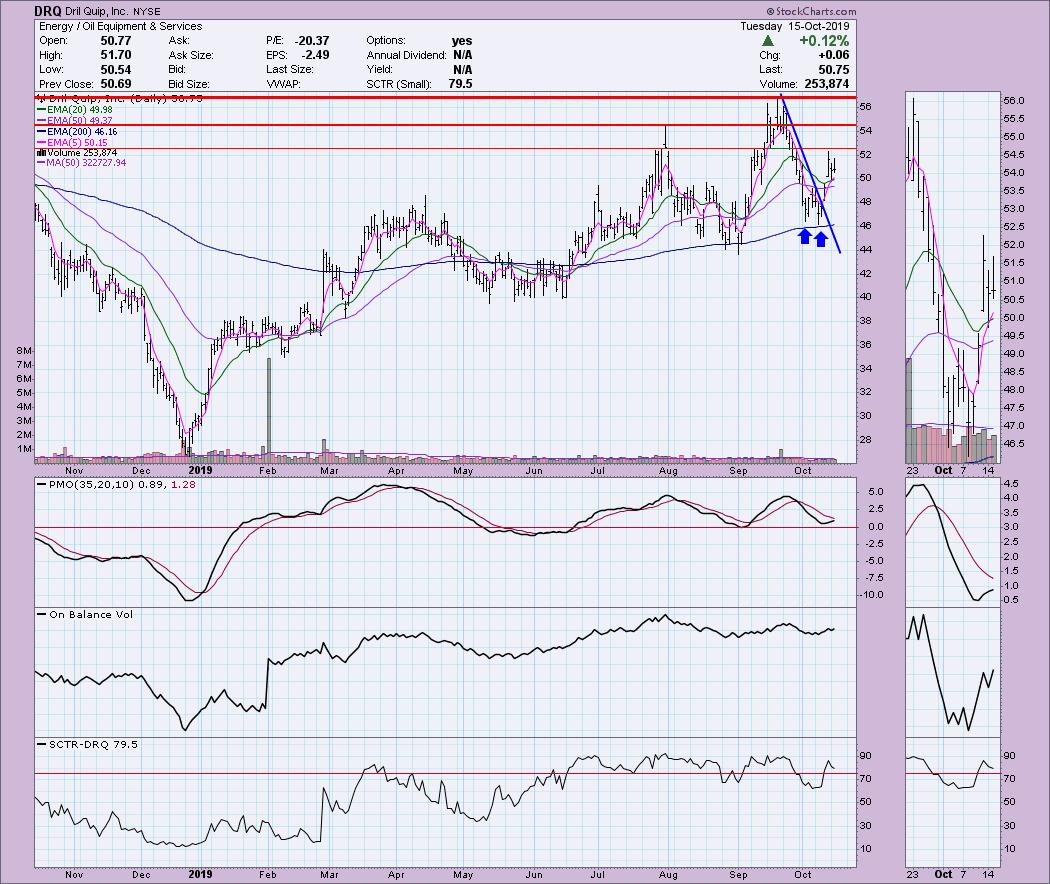
Drill Quip Inc (DRQ) - Earnings: 10/23 - 10/28/2019
I would've liked to have caught this one on the execution of that double-bottom pattern sitting on the 200-EMA, but it has pulled back toward the point of the breakout. Very short-term overhead resistance is near (thin support/resistance line) but upside potential using the other areas of overhead resistance looks profitable. The PMO turned up above the zero line, which is bullish, and it appears volume is behind this rally.
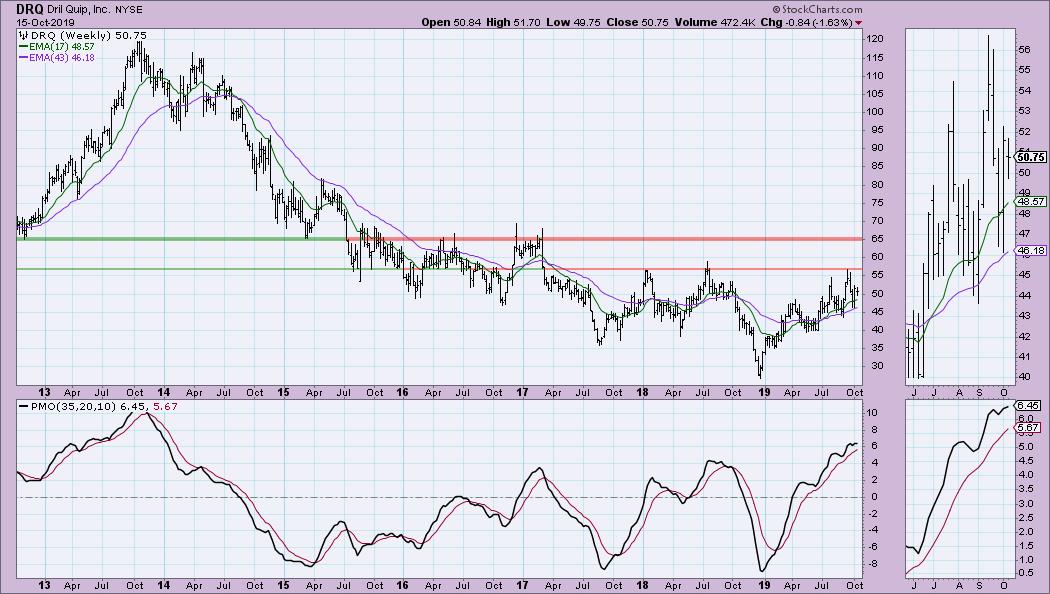
The weekly PMO is healthy and has room to test the top from 2013. Nearest overhead resistance is about $57 based on both the daily and weekly charts, but I believe it could push to $65.
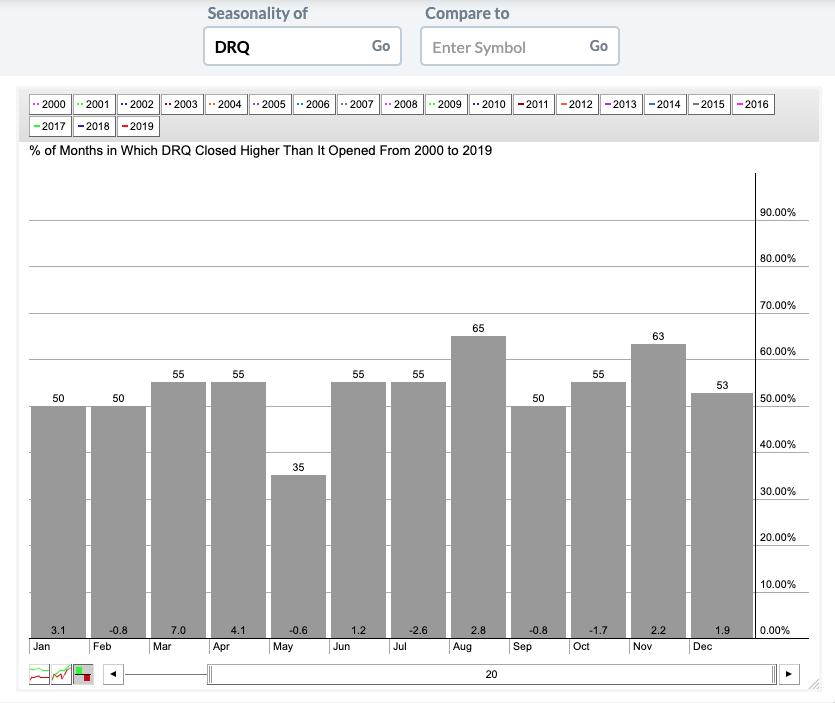
Seasonality looks good given that, in the last 20 years, DRQ has typically ended the months of November and December higher.
Home Depot Inc (HD) - Earnings: 11/19/2019
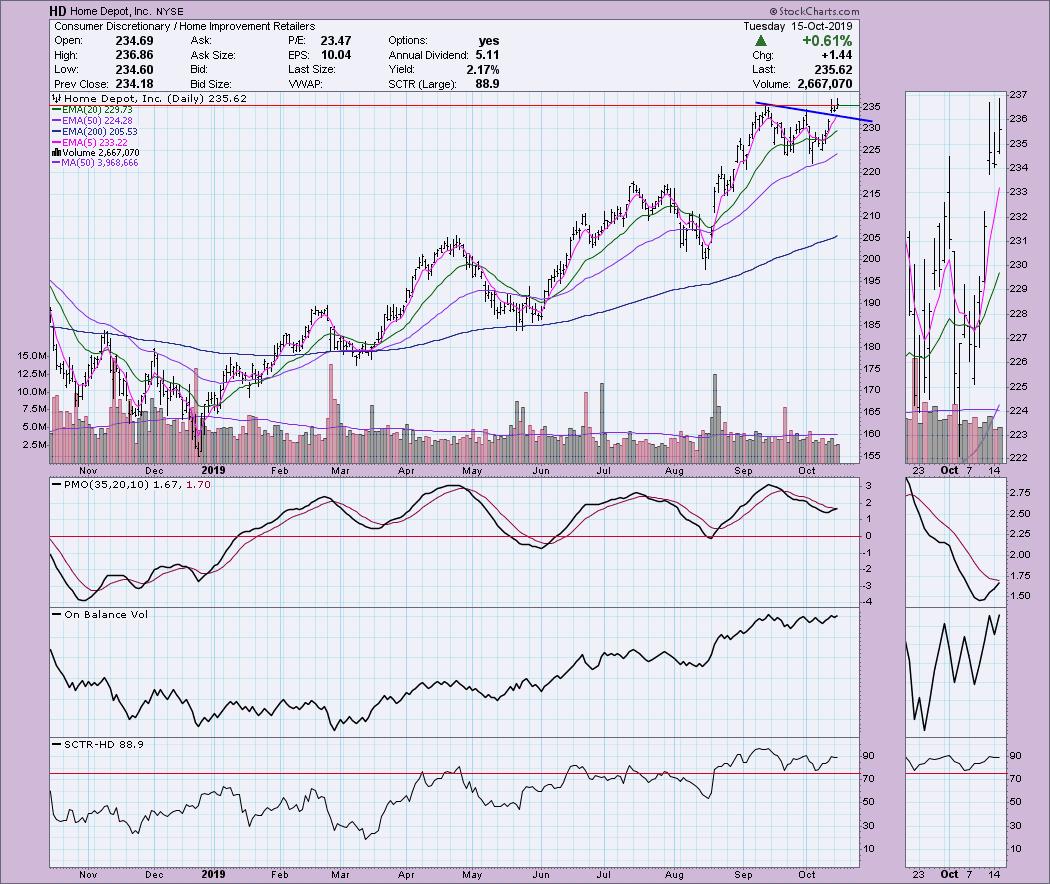
Home Depot broke out of a declining trend and is testing overhead resistance at the September top. It has been trading above it since Friday, but we really haven't gotten a close above it yet. The PMO and OBV are healthy and rising overall.
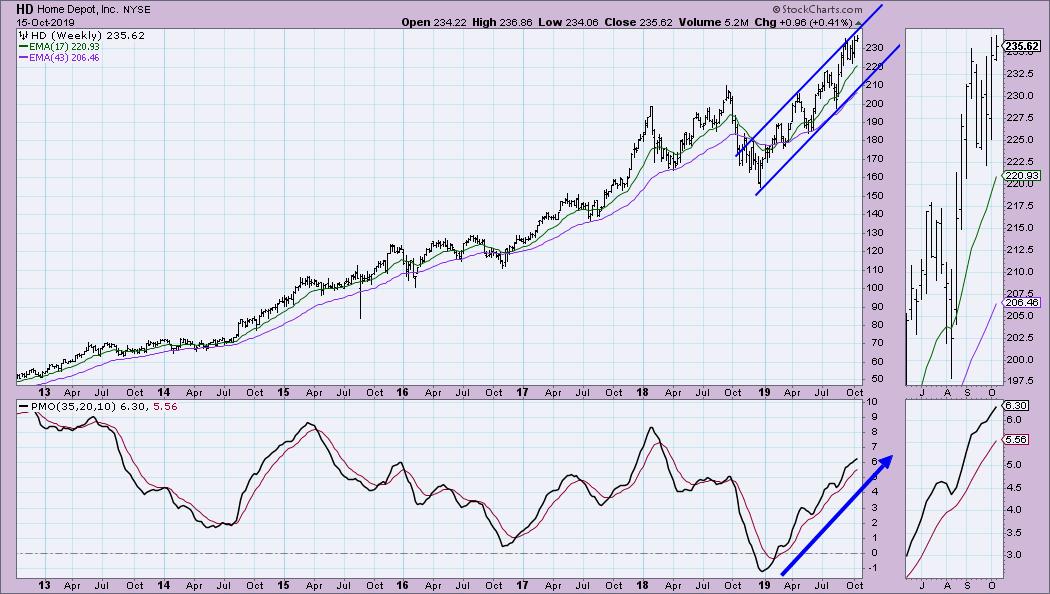
A steady, rising trend is visible on the weekly chart. The PMO is on trend with price and is not overbought.
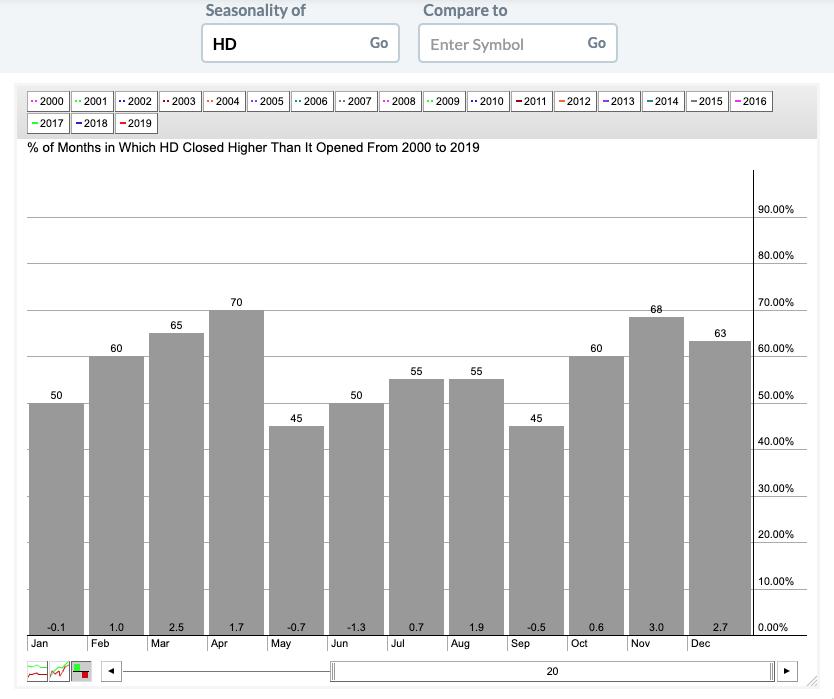
November and December are the best months for HD over the past 20 years.
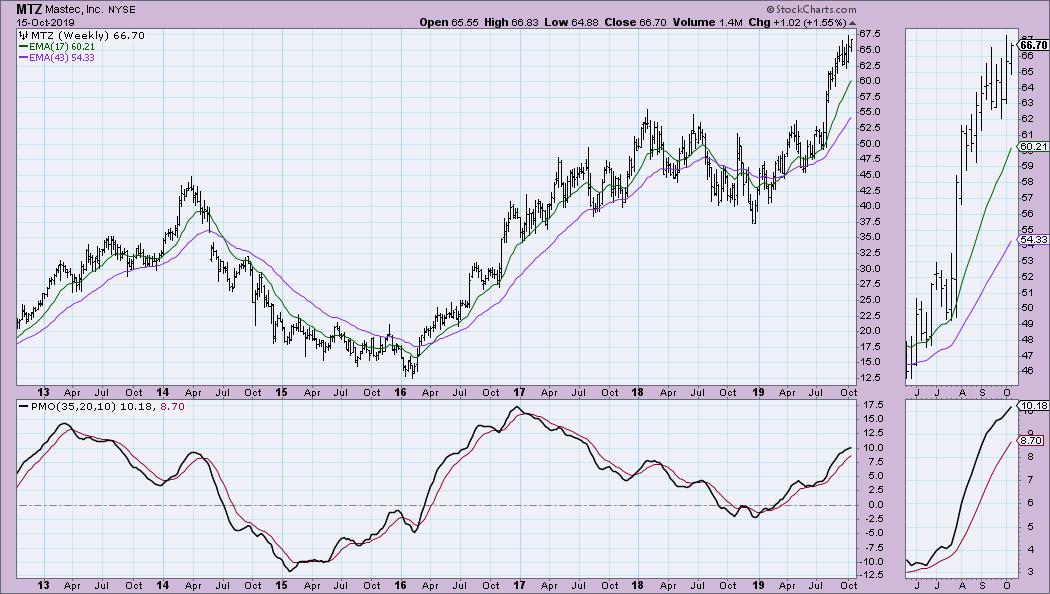
Mastec Inc (MTZ) - Earnings: 10/30 - 11/4/2019
This chart is very similar to HD above, with a broken declining trend and ongoing testing of overhead resistance. Volume is coming in on the rally, which remains strong internally and relatively based on the SCTR.
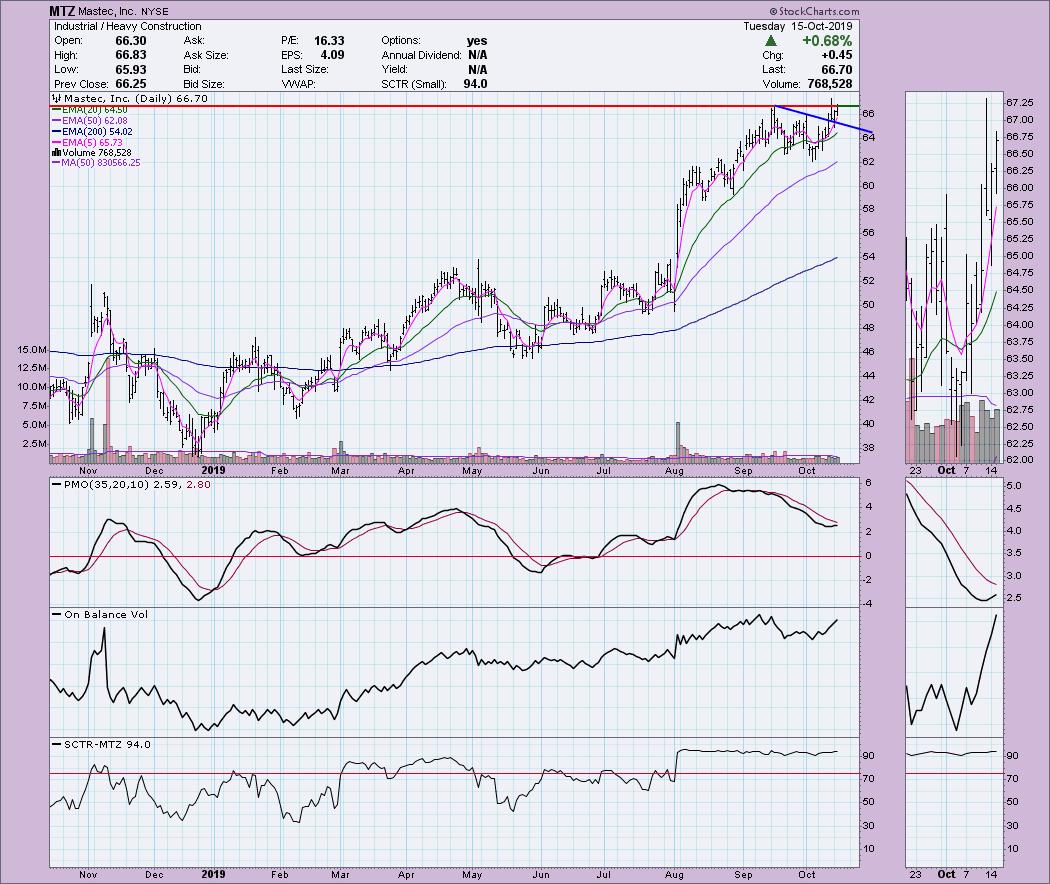
In the thumbnail, we see the weekly PMO is beginning to accelerate again and is not overbought.
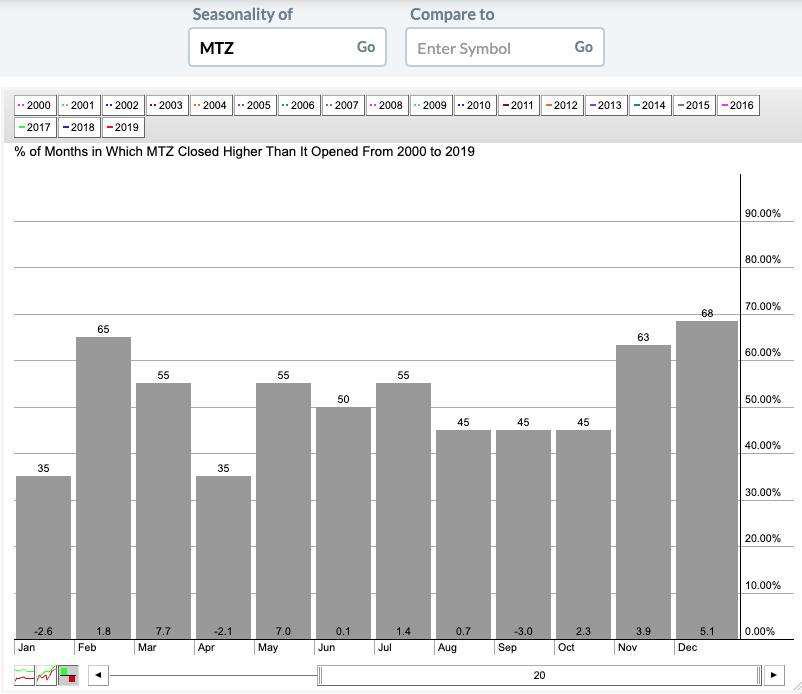
November and December show strong positive seasonality.
Old Republic Intl Corp (ORI) - Earnings: 10/23 - 10/28/2019
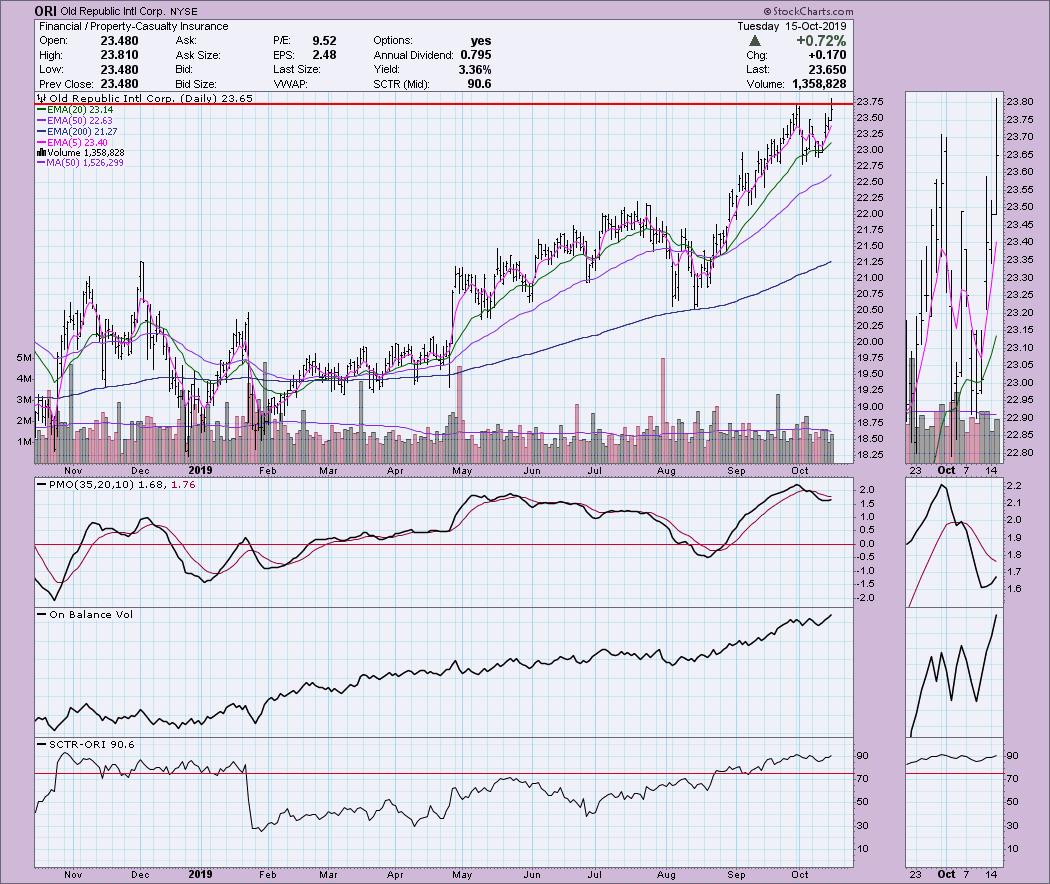
Nice breakout for ORI, although it didn't actually close above resistance. The PMO is hooking up nicely, but admittedly is in overbought territory. I'll forgive that based on the OBV breakout that occurred today in conjunction with price.
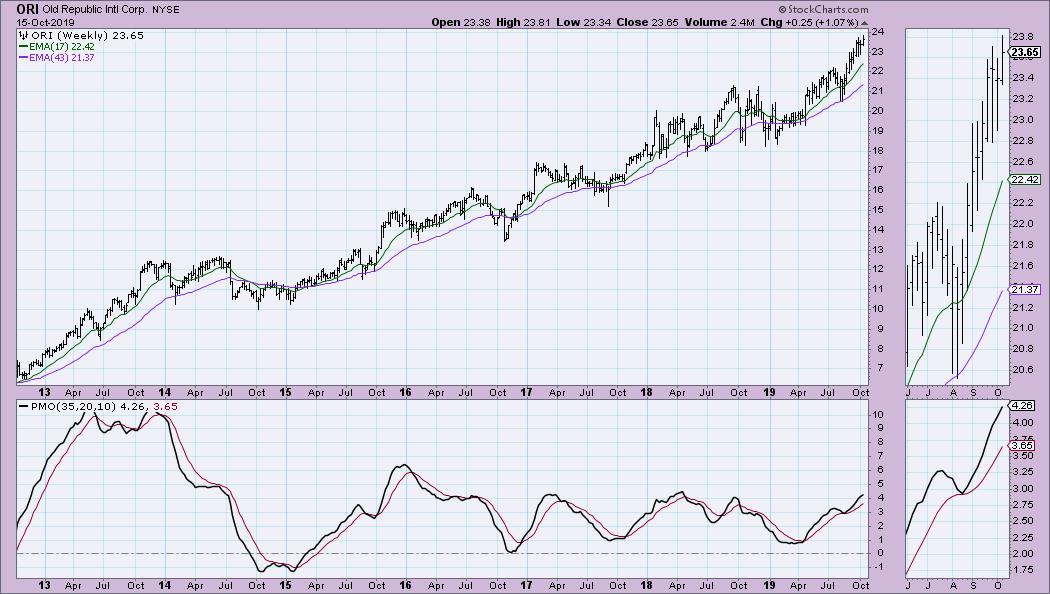
Additionally, the weekly chart is bullish. While the weekly PMO is overbought with respect to the tops from 2015-2018, it has reached much higher based on readings from 2013 and 2014.
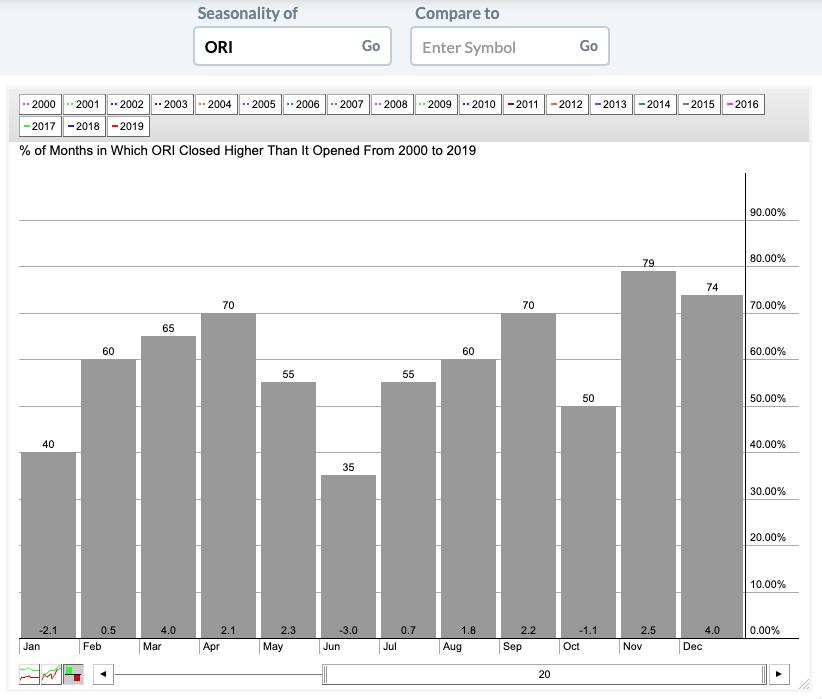
There is strong seasonality behind ORI for November and December.
Wyndham Destinations (WYND) - Earnings: 10/30/2019
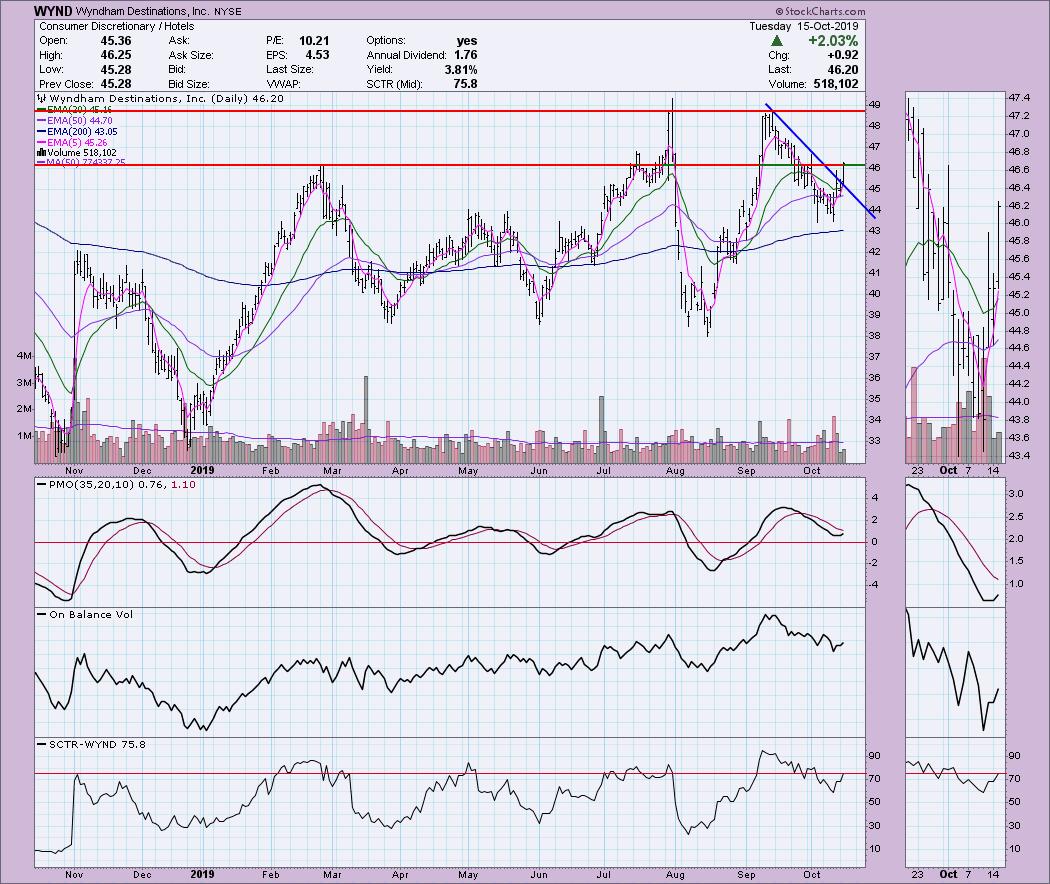
We had a beautiful breakout today for WYND out of a declining trend that began in September. It is testing resistance at the February top, but I think that won't be a problem. There may be a pullback toward that declining tops trend line given the 2.03% gain today. The PMO turned up above the zero line, which implies internal strength. I'd like to see more pickup in volume.
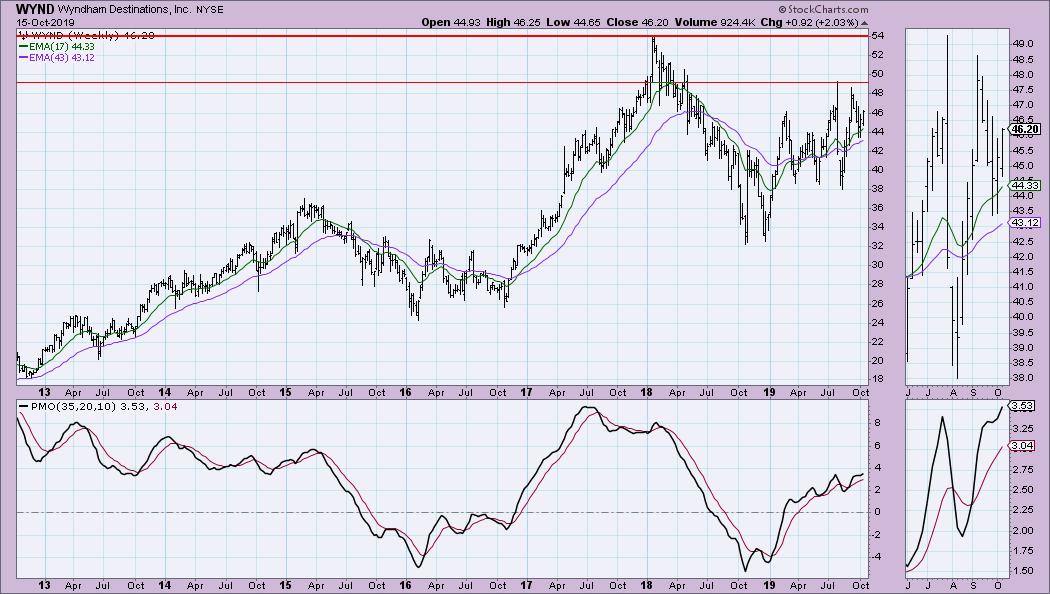
Overhead resistance is clear at $49. That would still be a meaningful gain. The PMO has now turned up and has popped above its previous top, which I find bullish.
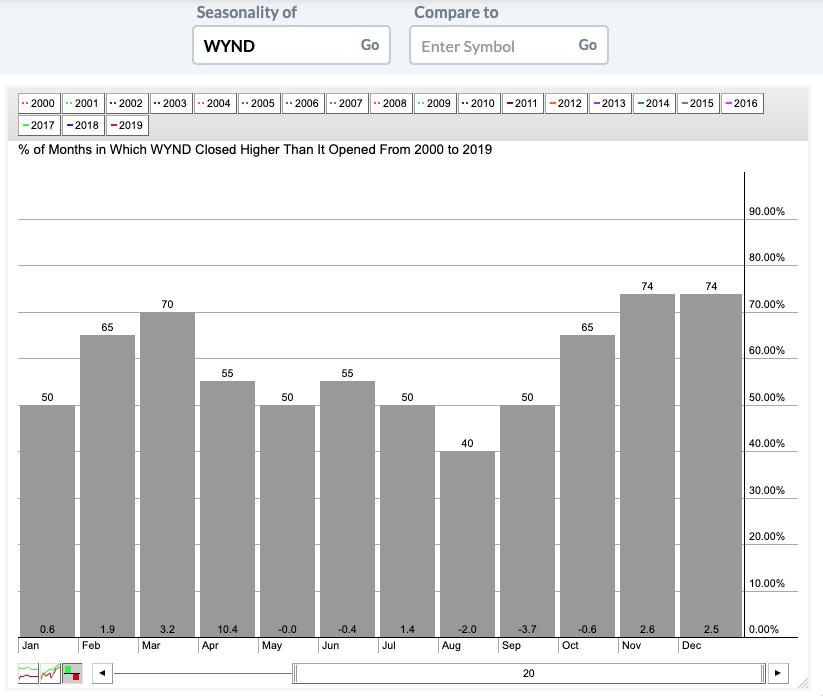
74% of the time, November and December show a positive gain of about 2.5%.
Full Disclosure: I do not own any of the stocks above and I am not planning on purchasing these or any additional stocks at this time. I'm currently about 60% in cash and watching my stops closely.

SAVE THE DATE!!
Erin Swenlin will be presenting at the TradersExpo in New York City on March 15-17, 2020! You'll have an opportunity to meet Erin and discuss the latest DecisionPoint news and Diamond Scans. The conference is free to attend or view online!
Watch the latest episode of DecisionPoint with Carl & Erin Swenlin LIVE on Mondays 5:00p EST or on the StockCharts TV YouTube channel here!
Technical Analysis is a windsock, not a crystal ball.
Happy Charting!
- Erin
erinh@stockcharts.com
NOTE: The stocks reported herein are from mechanical trading model scans that are based upon moving average relationships, momentum and volume. DecisionPoint analysis is then applied to get five selections from the scans. The selections given should prompt readers to do a chart review using their own analysis process. This letter is not a call for a specific action to buy, sell or short any of the stocks provided. There are NO sure things or guaranteed returns on the daily selection of "diamonds in the rough."
Helpful DecisionPoint Links:
DecisionPoint Shared ChartList and DecisionPoint Chart Gallery
Price Momentum Oscillator (PMO)
Swenlin Trading Oscillators (STO-B and STO-V)
**Don't miss DecisionPoint Commentary! Add your email below to be notified of new updates"**
