
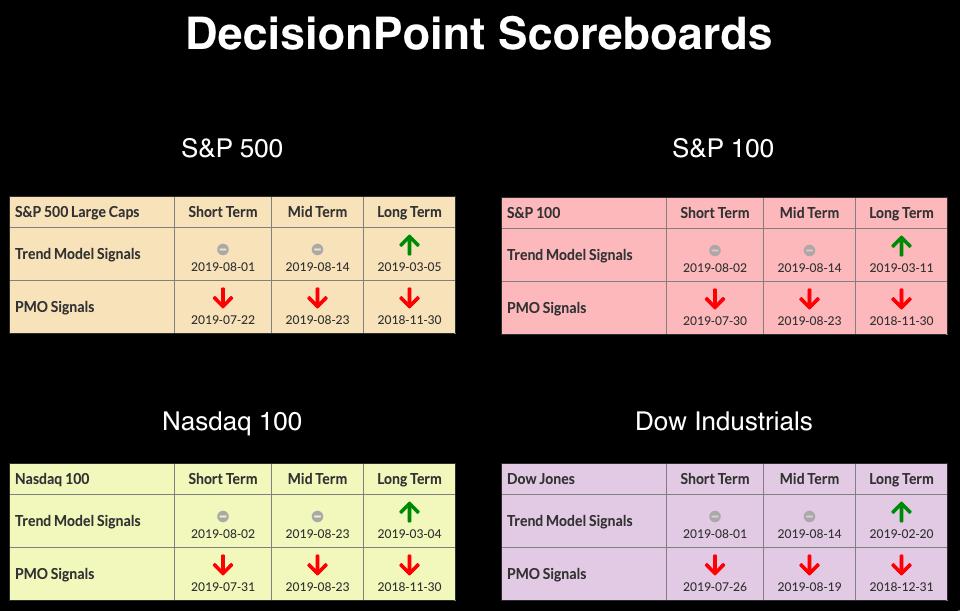
 The DecisionPoint Scoreboards are still very bearish; in spite of a recovery this week so far (1.43% higher for the SPX), the charts aren't favorable. I've analyzed volatility, breadth and our indicators and was only able to find one note of positivity. At this point, the only BUY signals left on the Scoreboards are the Long-Term Trend Model signals, which won't turn red until (and if) the 50-EMAs cross below 200-EMAs.
The DecisionPoint Alert presents a mid-week assessment of the trend and condition of the stock market (S&P 500), the U.S. Dollar, Gold, Crude Oil and Bonds.
Watch the latest episode of DecisionPoint on StockCharts TV's YouTube channel here!
GLOBAL MARKETS
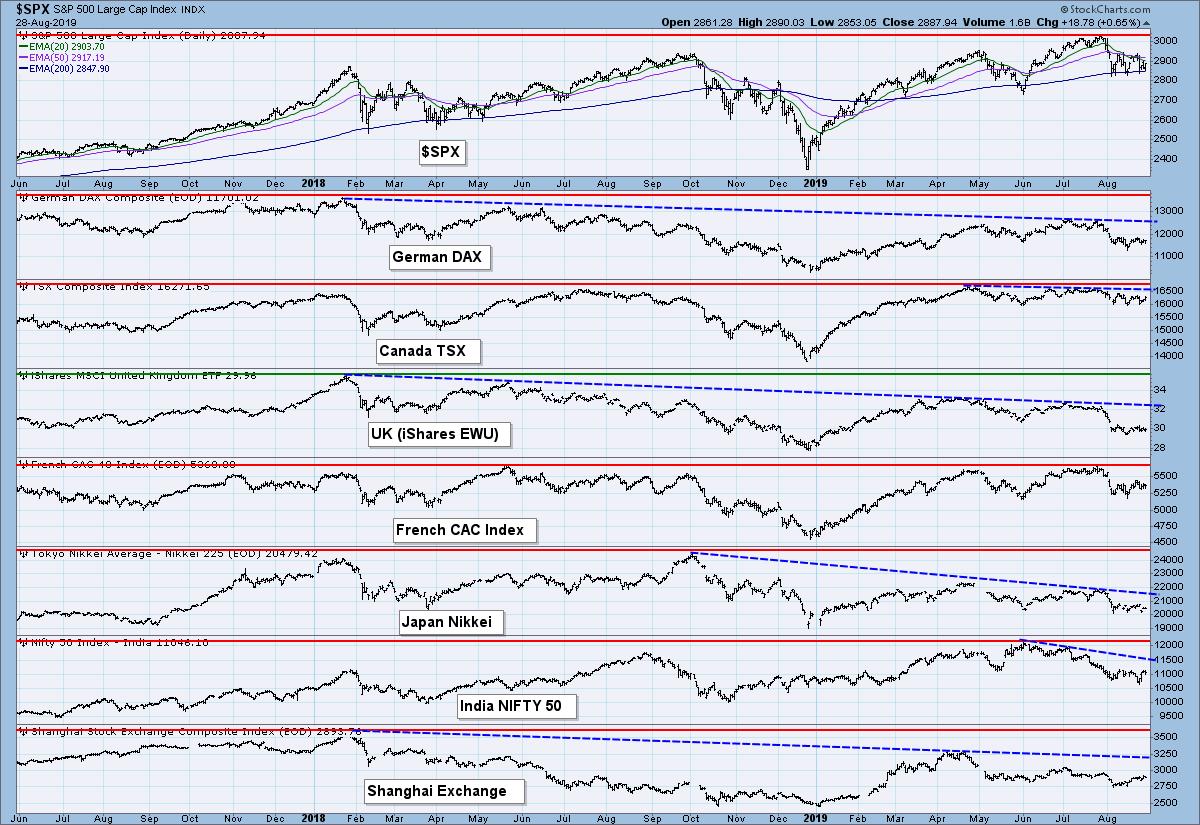
On this chart, I would like you to note that the US markets have been the only ones to break their declining trends by continuing to hit new all-time highs. It will be a long road upward to regain those all-time highs, but the other global indexes are still working to move out of their declining trends. Canada, France and India are probably the strongest given that they have both logged new all-time highs this year. However, take note of the deep declines of the rest and the distance they will have to travel in order to not only break from their declining trends, but also find their way back to new all-time highs.
BROAD MARKET INDEXES
SECTORS
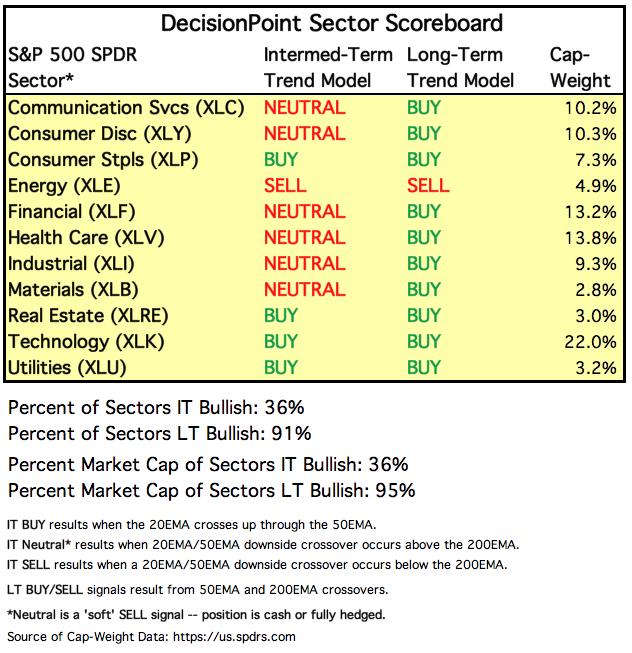
Each S&P 500 Index component stock is assigned to one, and only one, of eleven major sectors. This is a snapshot of the Intermediate-Term and Long-Term Trend Model signal status for those sectors.
STOCKS
IT Trend Model: Neutral as of 8/14/2019
LT Trend Model: BUY (SPY) as of 2/26/2019
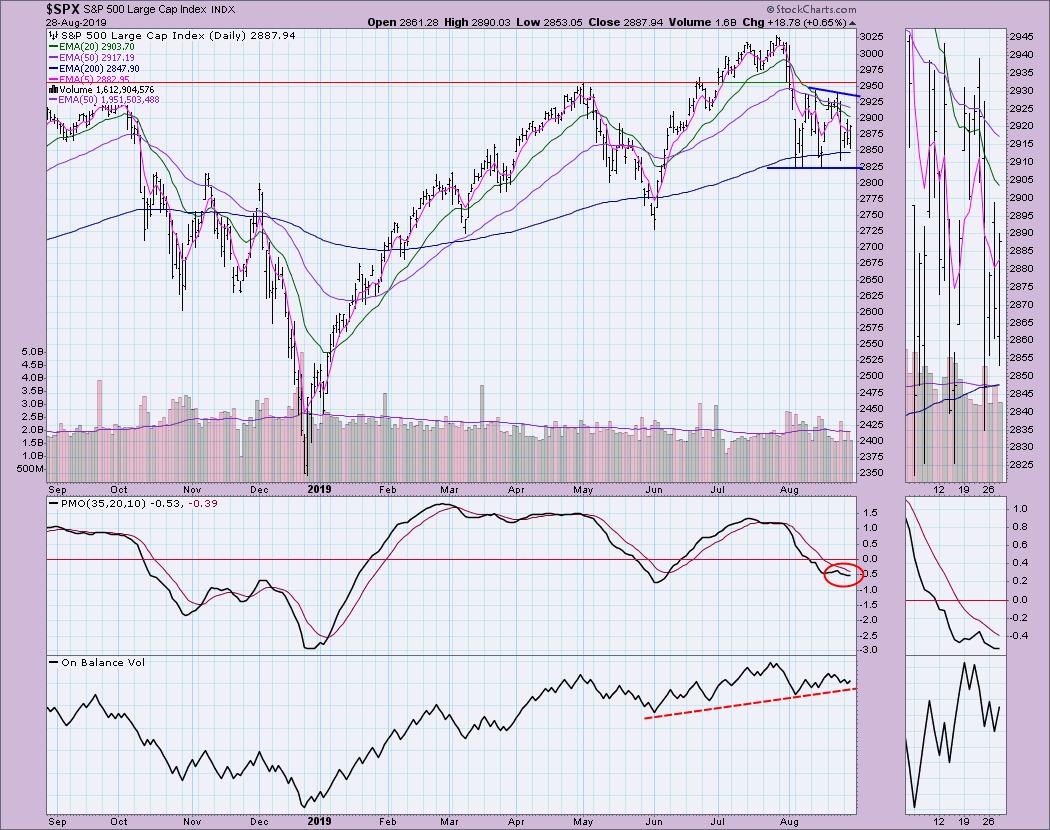
SPY Daily Chart: It's been a rough month, there's no arguing that fact - not given the wide trading range established this month. I had been looking at a possible bearish descending triangle forming, but I may soon be able to annotate a symmetrical triangle. In all honesty, a symmetrical triangle is a continuation pattern, meaning we should expect it to resolve downward. It appears that the 200-EMA and 2825 level is going to hold, but, given the wide trading range and high VIX numbers, I don't think the rough waters will calm anytime soon. I would've liked to have seen more volume today on the rally. Note that the OBV has broken its rising trend and isn't showing higher highs yet.
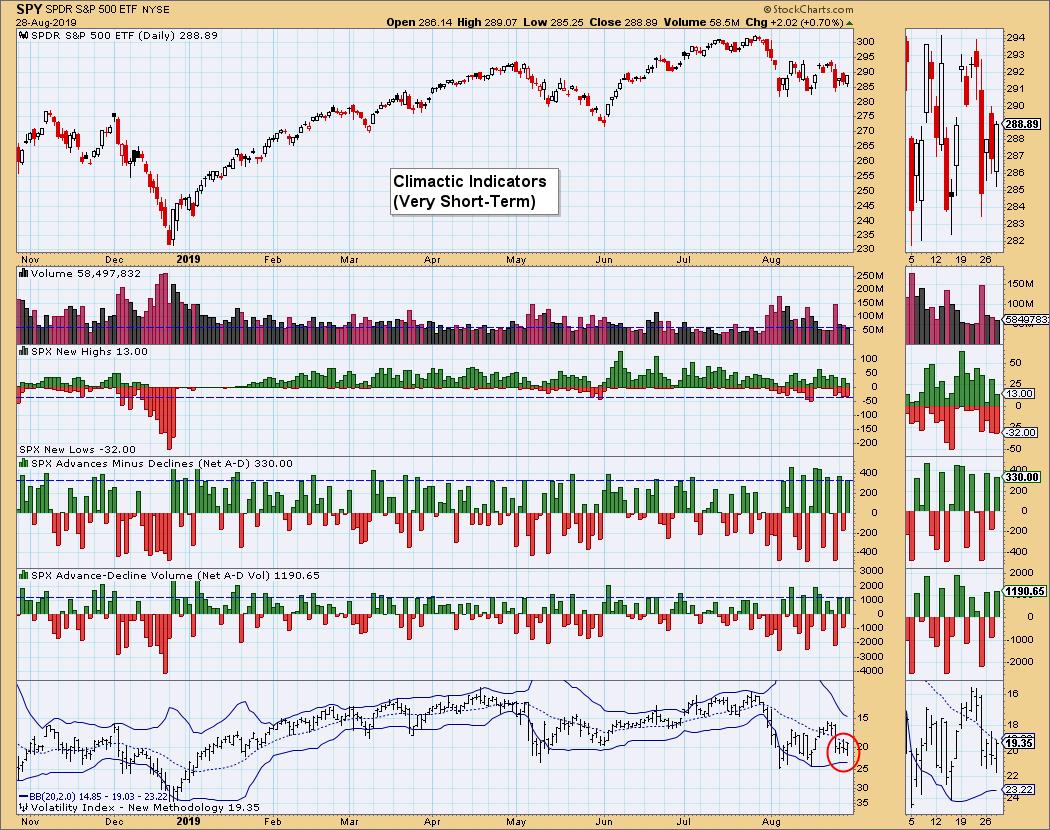
Climactic Market Indicators: Breadth was conflicted today. Note that there were more than twice the amount of new lows set versus new highs. That makes me concerned about the voracity of this rally. Volatility is still high, but it hasn't penetrated the lower Bollinger Band yet. I suspect it will test it before we see a continuation of today's rally.
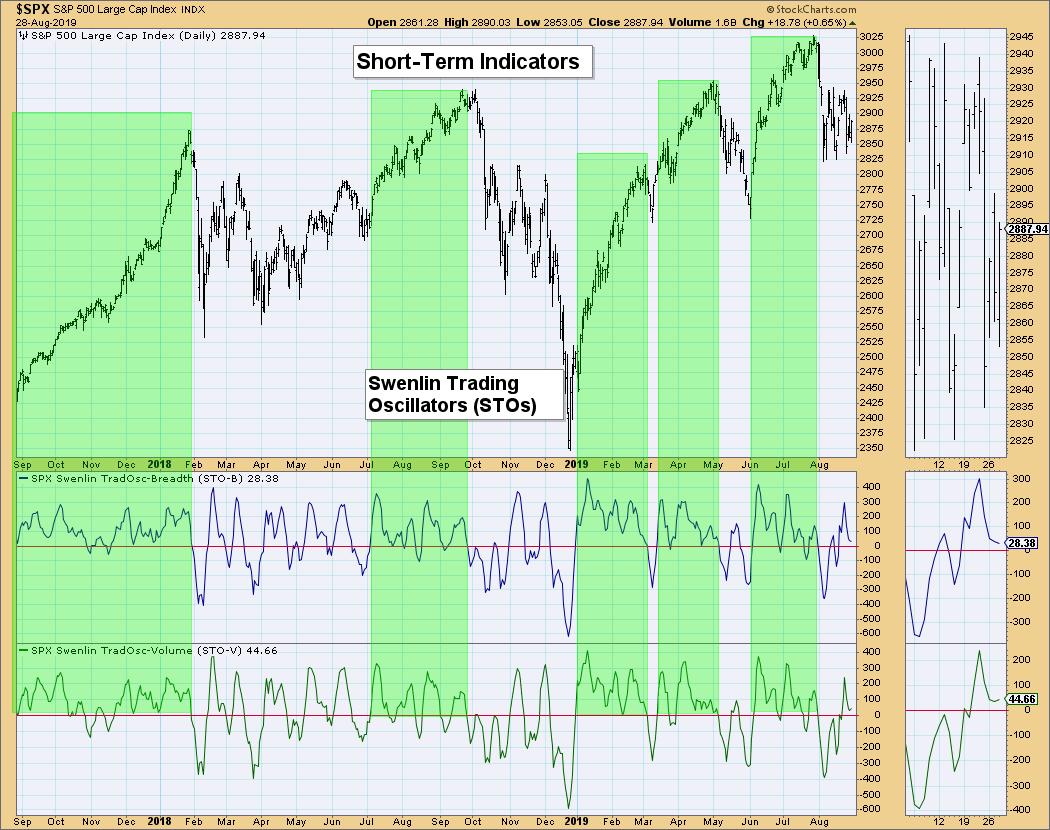
Short-Term Market Indicators: These indicators are trying to turn back up, but they are essentially still in decline and far from oversold. If we see them follow through on setting these lows above the zero line, I'll feel far better about the prospect of breaking out of this volatile trading range.
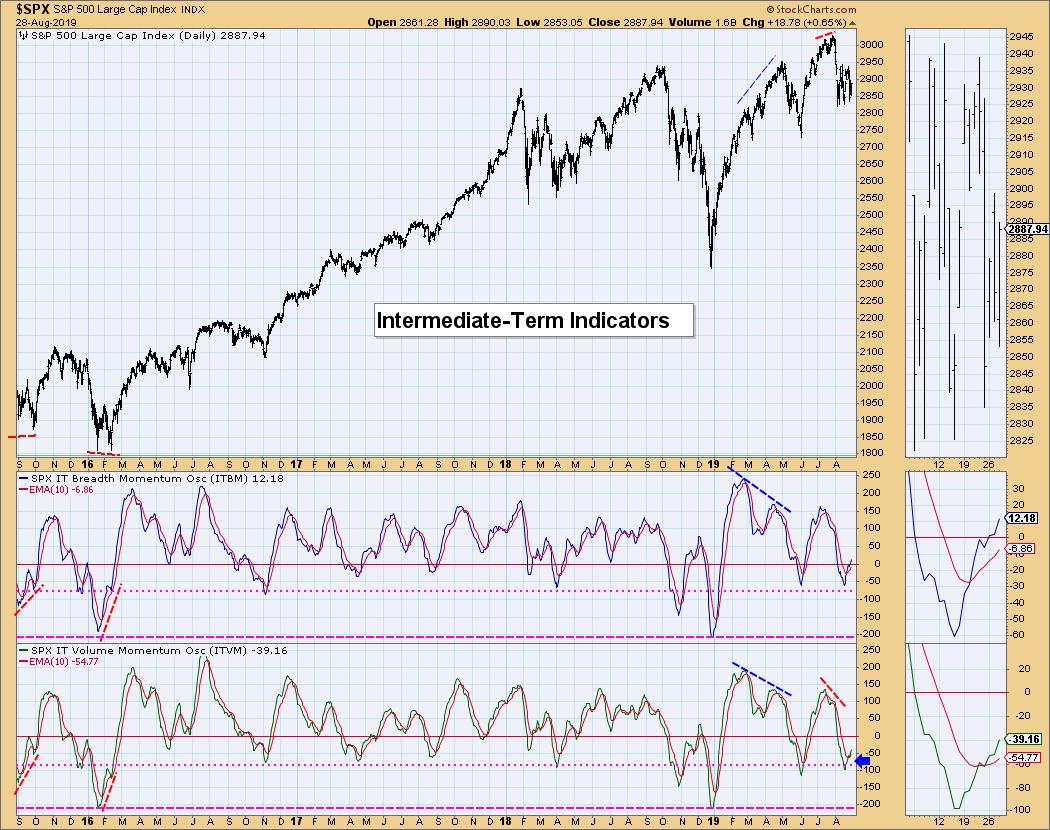
Intermediate-Term Market Indicators: This chart was the only real bright spot today. We are still seeing both the ITBM and ITVM rising; the ITVM is working its way toward crossing above the zero line.
Conclusion: The market is still showing plenty of volatility. This is not the best time to be getting in and it's important to start tightening stops. Full disclosure: today I sold my large position SPX-following Funds and moved into a REIT with a small position size. I'm now about a third in cash right now. I'll reinvest when volatility begins to subside. Our IT indicators suggest that prices should break out to the upside from this large trading range.
DOLLAR (UUP)
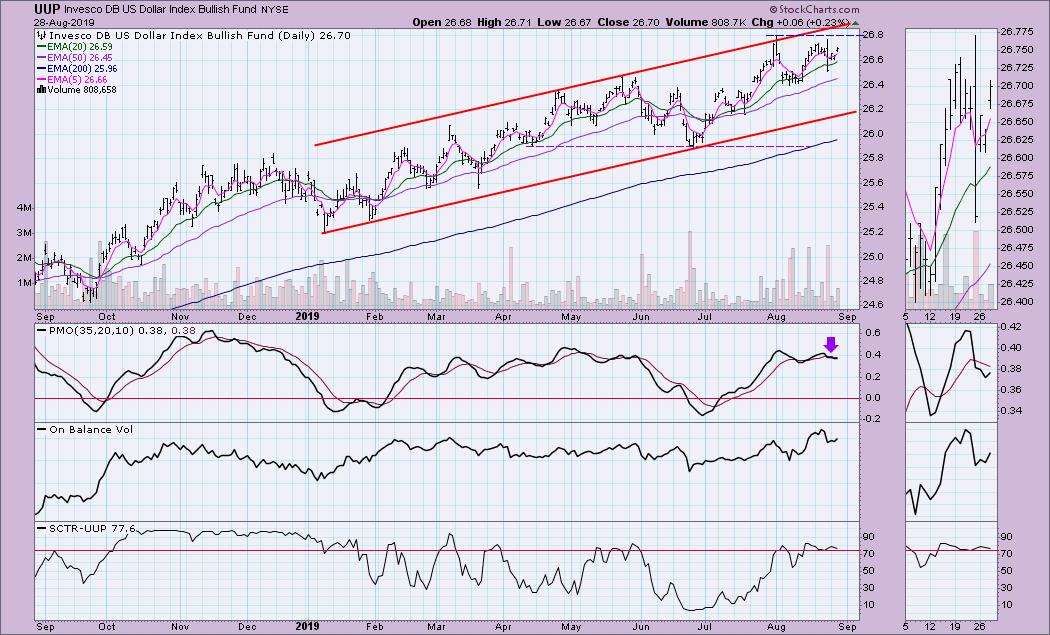
IT Trend Model: BUY as of 2/7/2019
LT Trend Model: BUY as of 5/25/2018
UUP Daily Chart: The Dollar is beginning to bump against overhead resistance. For UUP, that means the $26.80 level. I suspect the Dollar will maintain the rising trend, but the PMO needs a BUY signal before I look for a nice breakout. This rising trend would hold up even if price dropped below $26.30, so I'd be hands off UUP right now in both the short and intermediate terms.
GOLD
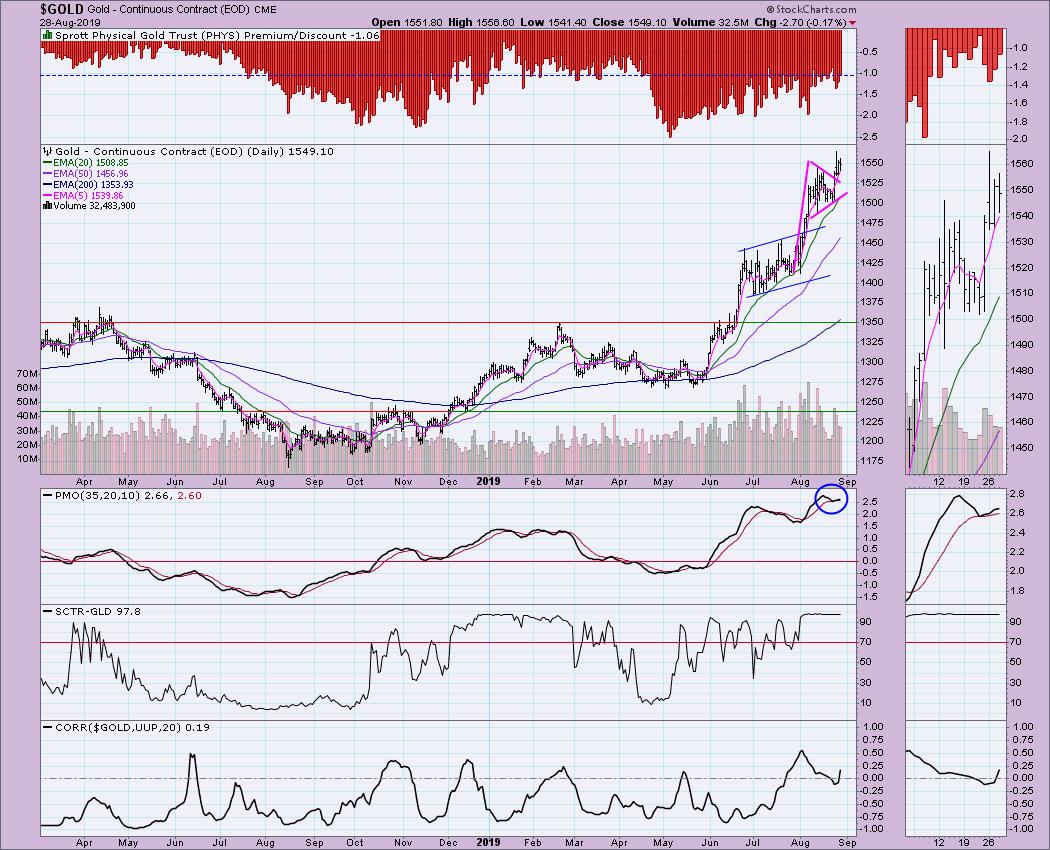
IT Trend Model: BUY as of 6/3/2019
LT Trend Model: BUY as of 1/8/2019
GOLD Daily Chart: Gold has completely uncoupled from the Dollar. The 20-MA of the correlation is near zero. This means that Gold has and can continue to travel without much influence from the Dollar. What I find interesting is that you can still get PHYS with a discount. At this point, I'm still very bullish on Gold. It appears we have another flag formation and a breakout. The PMO is very overbought right now, so I suspect we could see some consolidation here before another breakout rally. Consolidation works just fine to pull the PMO out of overbought territory.
CRUDE OIL (USO)
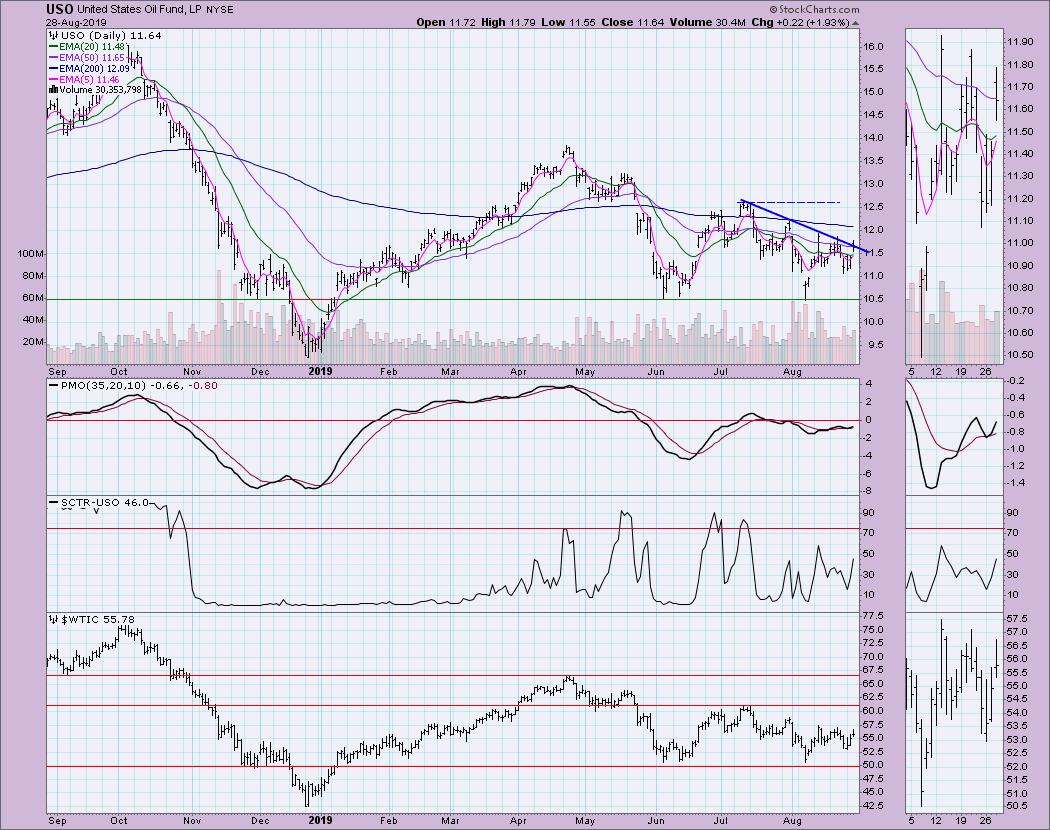
IT Trend Model: Neutral as of 5/30/2019
LT Trend Model: SELL as of 6/4/2019
USO Daily Chart: USO is attempting to break out from a declining tops trend line. In the intermediate term, we have a descending triangle, which would imply a breakdown below $10.50. Short term, the PMO is turning up and attempting to make a move above the zero line on a BUY signal. While a breakout here is possible, I believe the downside risk is too high to get in right now. The 50-EMA is below the 200-EMA, which tells us we are in a bear market for Oil. We should expect bearish outcomes over bullish ones.
BONDS (TLT)
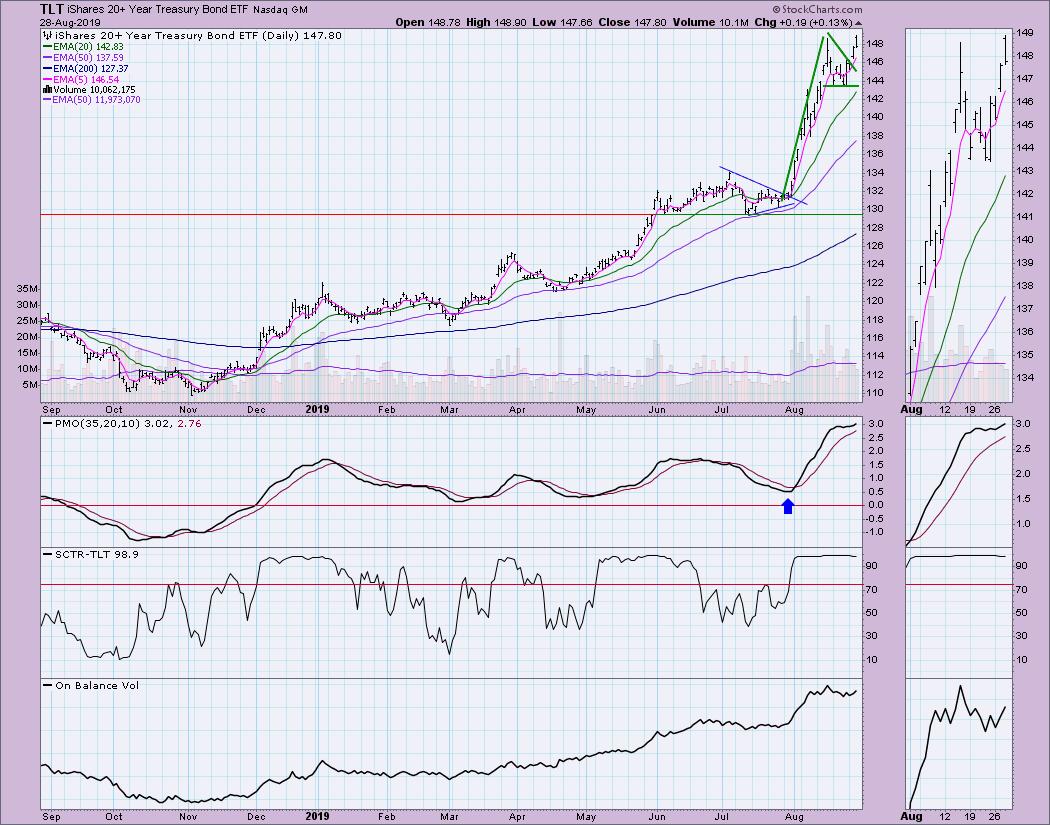
IT Trend Model: BUY as of 12/6/2018
LT Trend Model: BUY as of 1/2/2019
TLT Daily Chart: A very nice bull flag formed on TLT and we got a breakout. My main concern is that, while it set an intraday all-time high today, it closed below that resistance. We may have to see this flag develop more with consolidation. The PMO is very overbought, but it is rising again. While the market continues to be volatile, I would expect bonds, like Gold, will remain in favor. I would just be at the ready in case this vertical move turns around and becomes a vertical move in the opposite direction.
Technical Analysis is a windsock, not a crystal ball.
Happy Charting! - Erin
Email: erinh@stockcharts.com
**Don't miss any of the DecisionPoint commentaries! Go to the "Notify Me" box toward the end of this blog page to be notified as soon as they are published.**
NOTE: The signal status reported herein is based upon mechanical trading model signals, specifically, the DecisionPoint Trend Model. They define the implied bias of the price index based upon moving average relationships, but they do not necessarily call for a specific action. They are information flags that should prompt chart review. Further, they do not call for continuous buying or selling during the life of the signal. For example, a BUY signal will probably (but not necessarily) return the best results if action is taken soon after the signal is generated. Additional opportunities for buying may be found as price zigzags higher, but the trader must look for optimum entry points. Conversely, exit points to preserve gains (or minimize losses) may be evident before the model mechanically closes the signal.
Helpful DecisionPoint Links:
DecisionPoint Shared ChartList and DecisionPoint Chart Gallery
Price Momentum Oscillator (PMO)
Swenlin Trading Oscillators (STO-B and STO-V)
