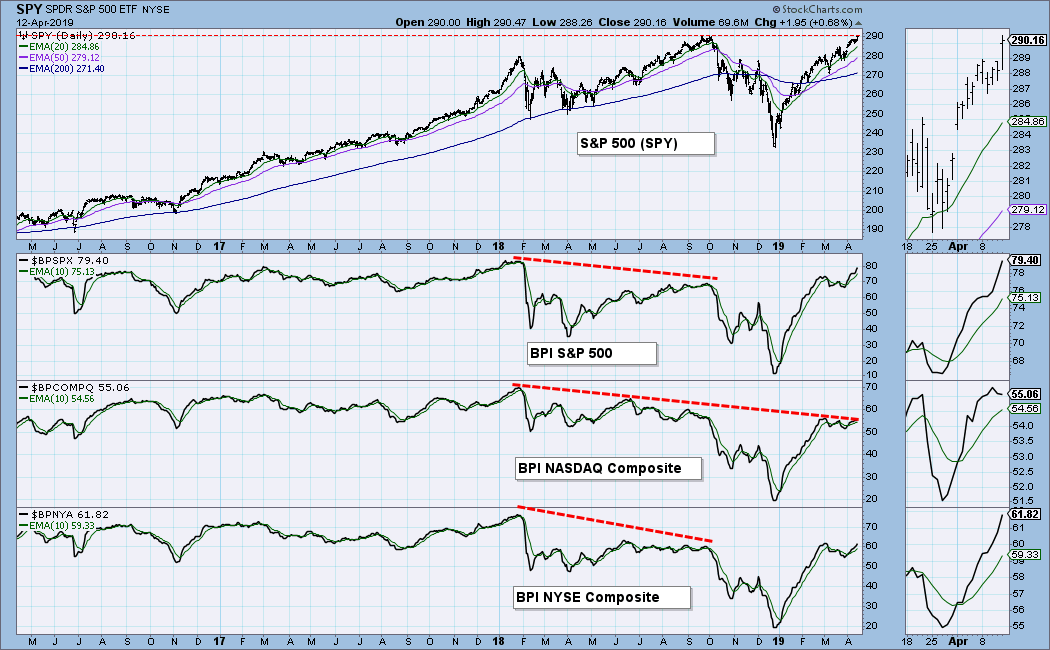
One of the market indicators available on StockCharts.com is the Bullish Percent Index (BPI), which calculates the percentage of stocks in a given index that are on point and figure BUY signals. On the chart below we can see the BPI for the S&P 500, the Nasdaq Composite, and NYSE composite. All three BPIs were at their highest levels in early-2018, but note the BPI negative divergences at the September 2018 price top. It is a clear case of fewer stocks supporting the price advance, with predictable results.
Currently, all three indexes are approaching record price highs. The S&P 500 BPI is near its 2018 high, confirming the price move, but there is a severe shortage of participating stocks in the BPIs for the Nasdaq and NYSE, which are respectively 25% and 23% below their early-2018 levels. Again, we have a clear case of fewer stocks supporting the price advance. While the S&P 500 BPI shows that large-cap stocks are still pulling their load, they are near the end of their tether.
The DecisionPoint Weekly Wrap presents an end-of-week assessment of the trend and condition of the stock market (S&P 500), the U.S. Dollar, Gold, Crude Oil, and Bonds.
Watch the latest episode of DecisionPoint on StockCharts TV's YouTube channel here!
GLOBAL MARKETS
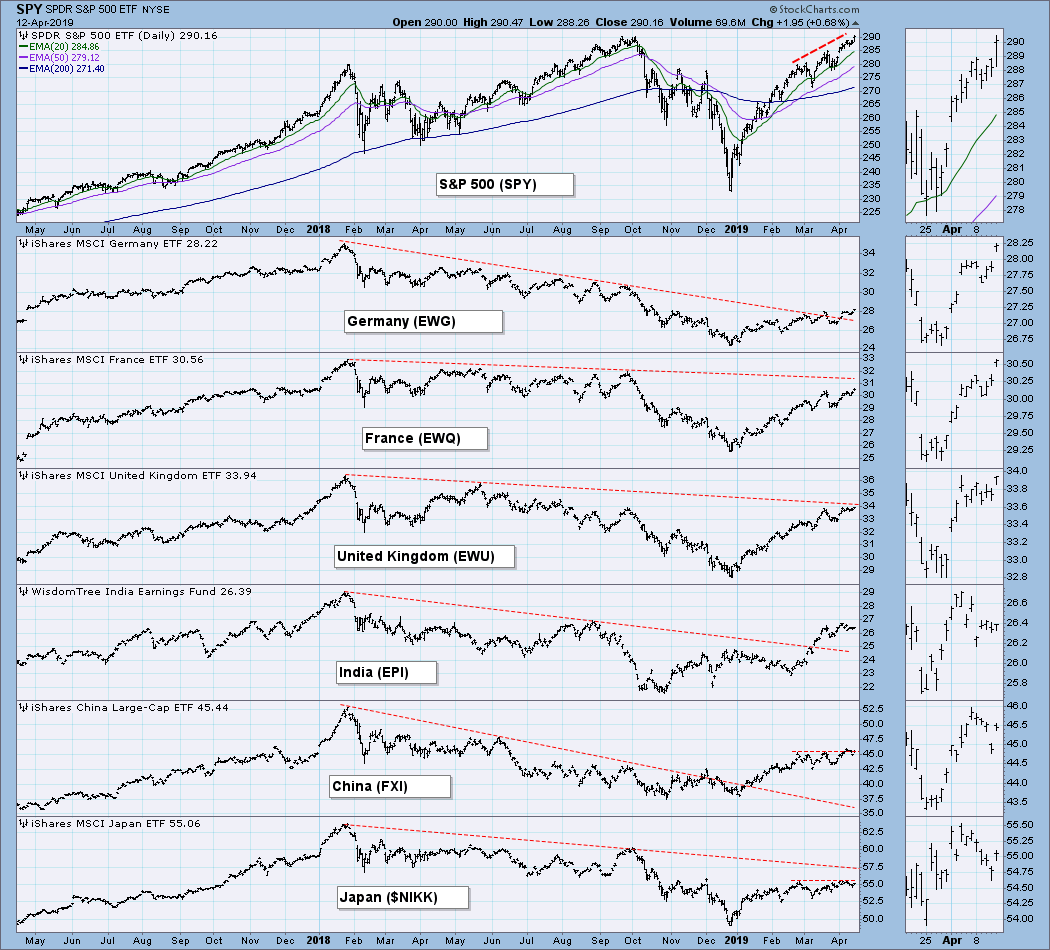
Global markets are still substantially below their February 2018 highs. And while some have broken above their declining tops lines, others have not and are still technically in bear markets.
BROAD MARKET INDEXES
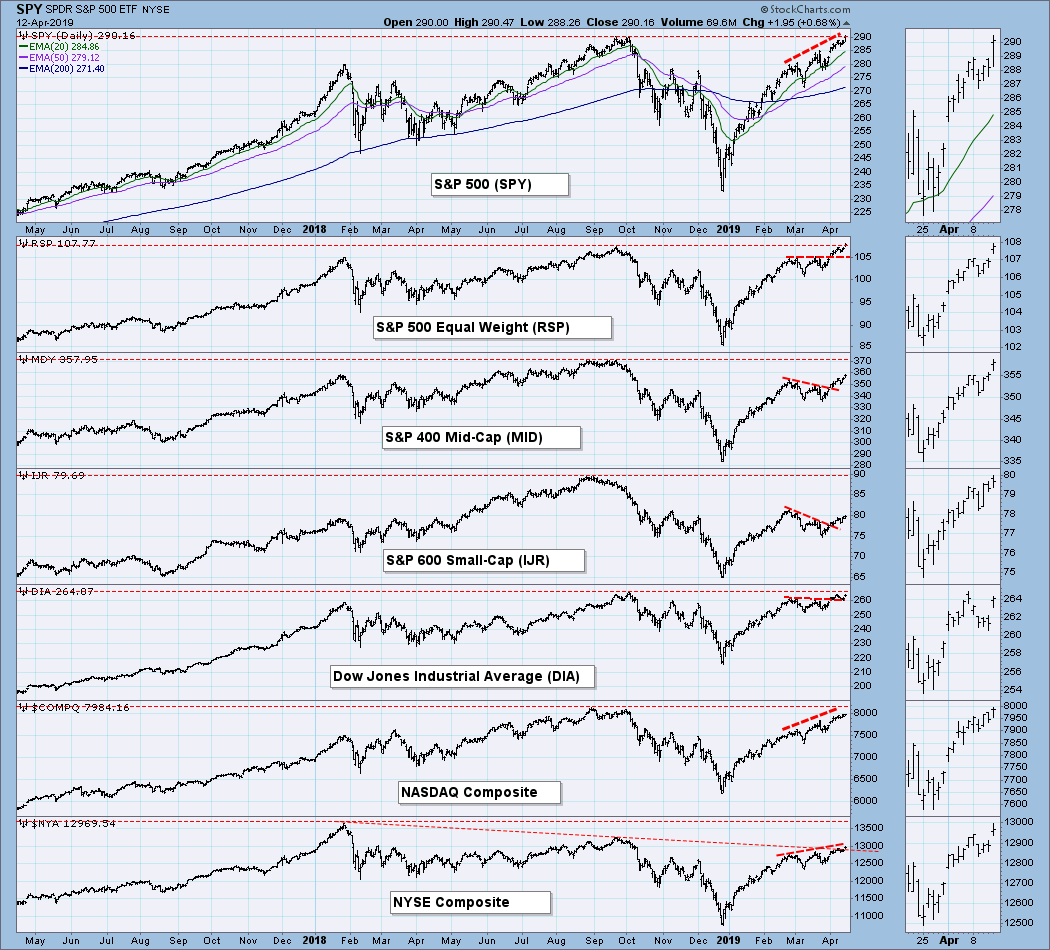
Large-cap indexes are approaching record highs, while the S&P 600 Small-Cap Index is still 12% below last year's high. Small-cap stocks were not the powerhouse we normally expect in a new bull market.
SECTORS
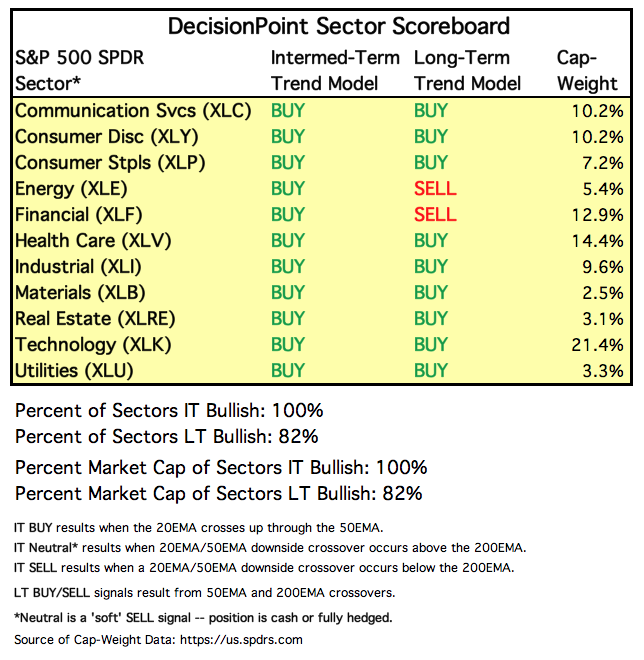
Each S&P 500 Index component stock is assigned to one, and only one, of 11 major sectors. This is a snapshot of the Intermediate-Term and Long-Term Trend Model signal status for those sectors.
STOCKS
IT Trend Model: BUY as of 2/1/2019
LT Trend Model: BUY as of 2/26/2019
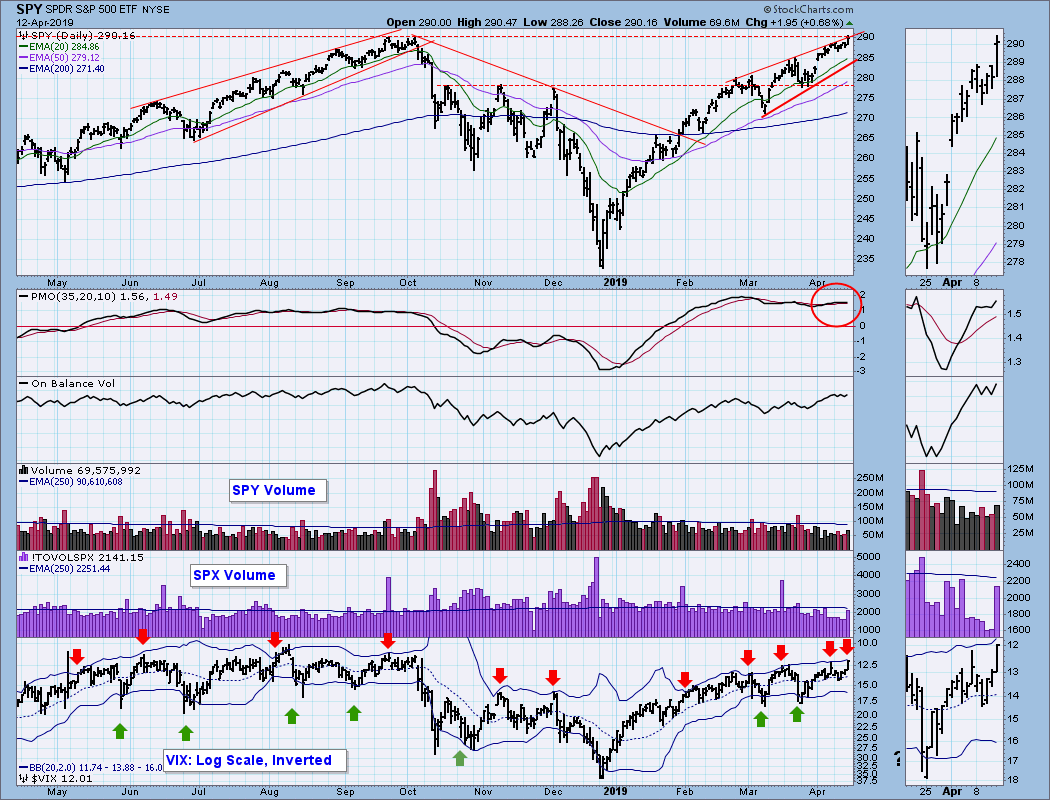
SPY Daily Chart: The market (SPY) made new all-time highs today. The S&P 500 Index ($SPX) did not make all-time highs today, but remember, the S&P 500 Index is not adjusted for dividends like ETFs and stocks are, so it is not actually as accurate as SPY.
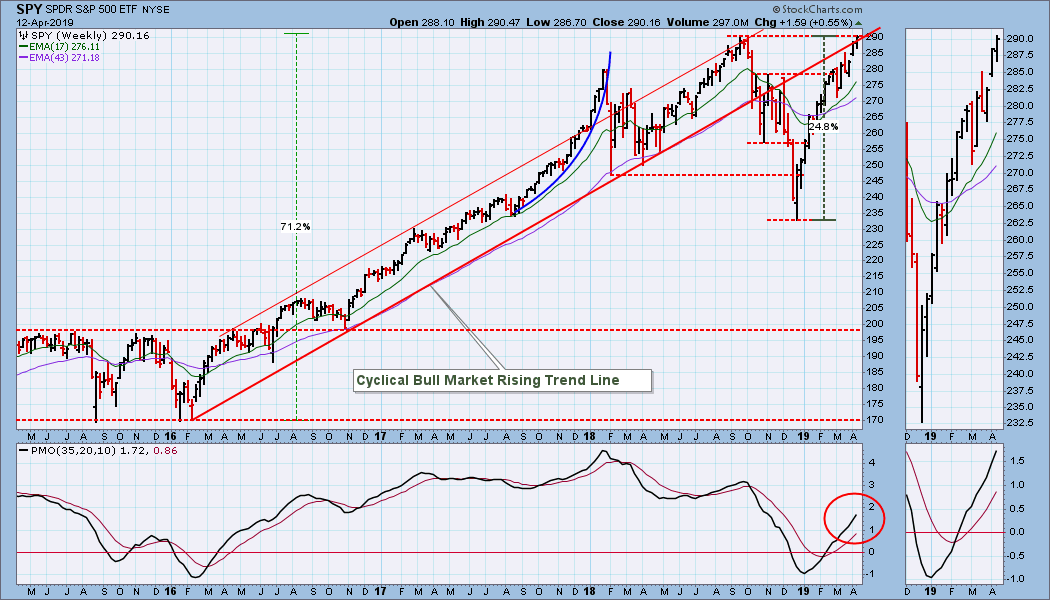
SPY Weekly Chart: While SPY hit a new high, it was a marginal gain, and it is at major resistance. I am wondering if we are about to see a massive double top. Erin made a point today on StockCharts TV that the angle of the price advance from the December low is too steep to be maintained. This weekly chart illustrates that point nicely. The last time we saw an advance this steep was the parabolic advance from November 2017 to January 2018, and we can see how that turned out.
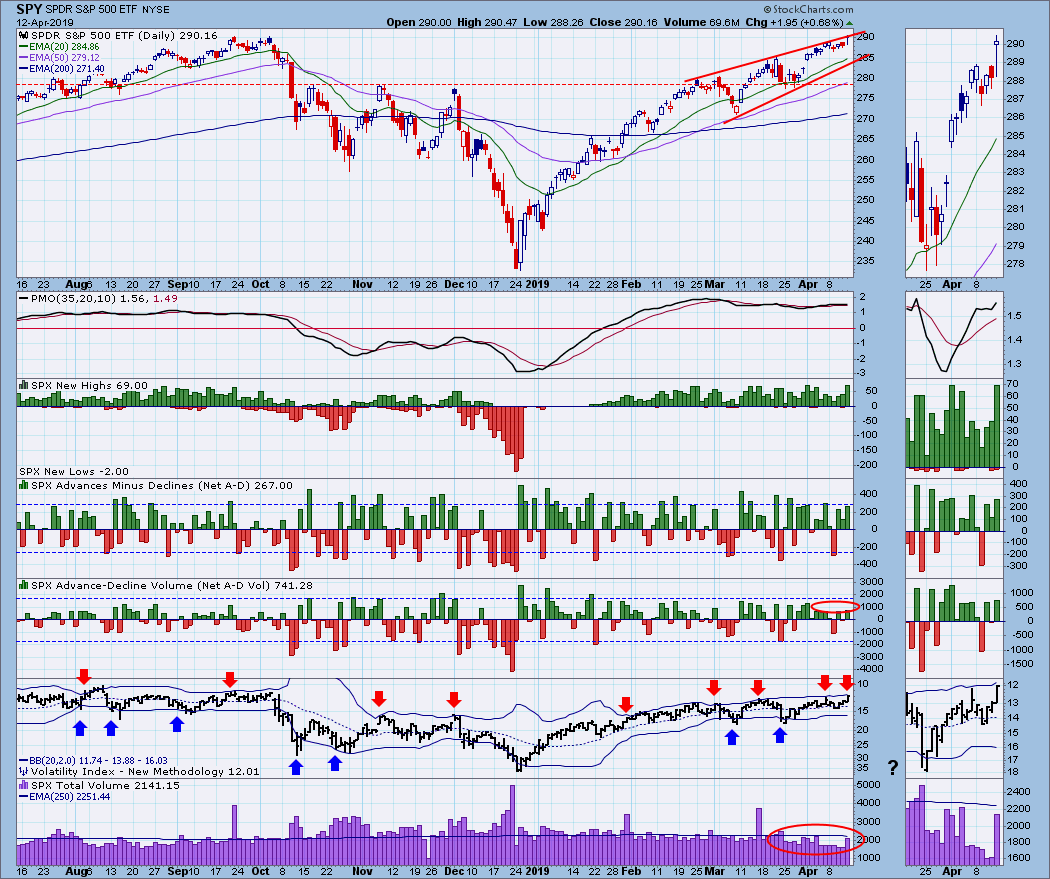
 Climactic Market Indicators: New Highs and Net Advance-Declines hit climactic levels, but Net A-D Volume has been thin for days. Also, raw SPX volume has been thin for most days in the last three weeks. The VIX has nearly reached the top Bollinger Band, so we should be alert for a price top. We had a similar setup last Friday, and it was followed by a price decline so shallow that it is hard to see, but those signals are still worth watching.
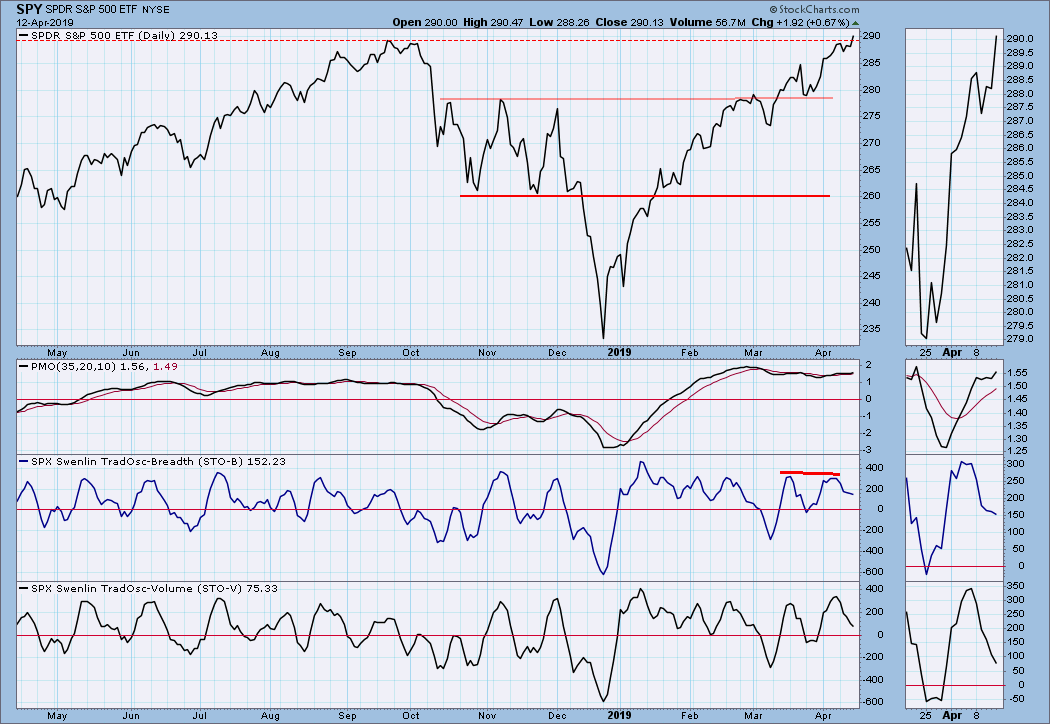
Short-Term Market Indicators: This chart gives the best view of the SPY record closing high.
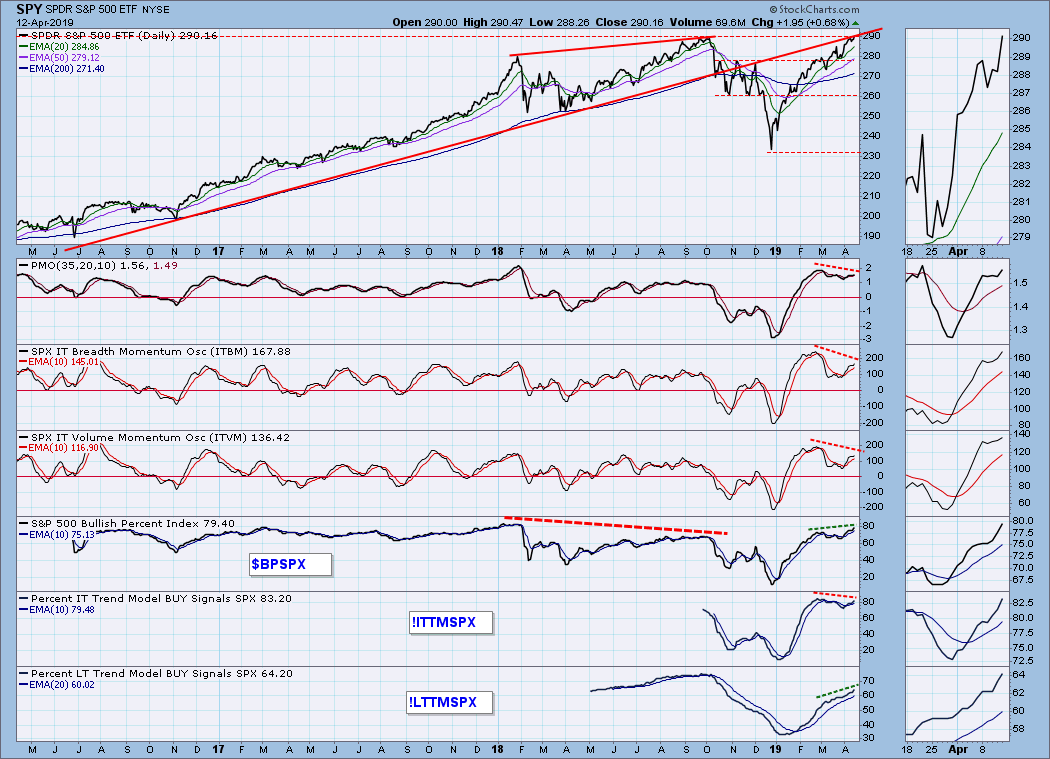
Intermediate-Term Market Indicators: We can see a lot of negative divergences developing, but they won't be 'locked in' until the indicators actually top. When that happens I still don't think the February tops will be exceeded. I have included the Percent of LT Trend Model BUY Signals indicator, and I am concerned that the current reading of 64.2 is far short of the September reading of 75.0 in September.
CONCLUSION: Significant resistance, too-steep a trend, many negative divergences, and thin volume are just a few of the technical issues that concern me. I am still of the opinion that now is not a good time to open new longs -- a major double top is not out of the question.
My usual heads up: Next week is options expiration, and we should expect market averages to be relatively quiet toward the end of the week. No guarantees, but that is pretty typical. Since it is not an end-of-quarter expiration, do not conclude that higher than normal volume is associated with expiration.
DOLLAR (UUP)
IT Trend Model: BUY as of 2/7/2019
LT Trend Model: BUY as of 5/25/2018
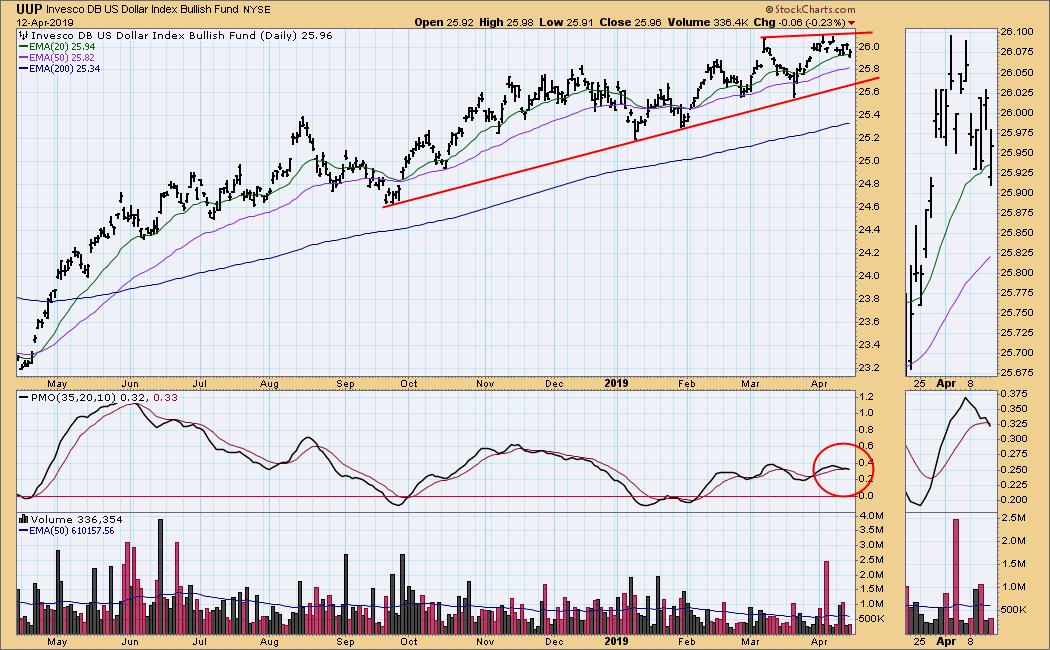
UUP Daily Chart: Price is in a bearish rising wedge, and the daily PMO is slightly positive and has been moving sideways for two months, indicating a steady, though weak upward momentum.
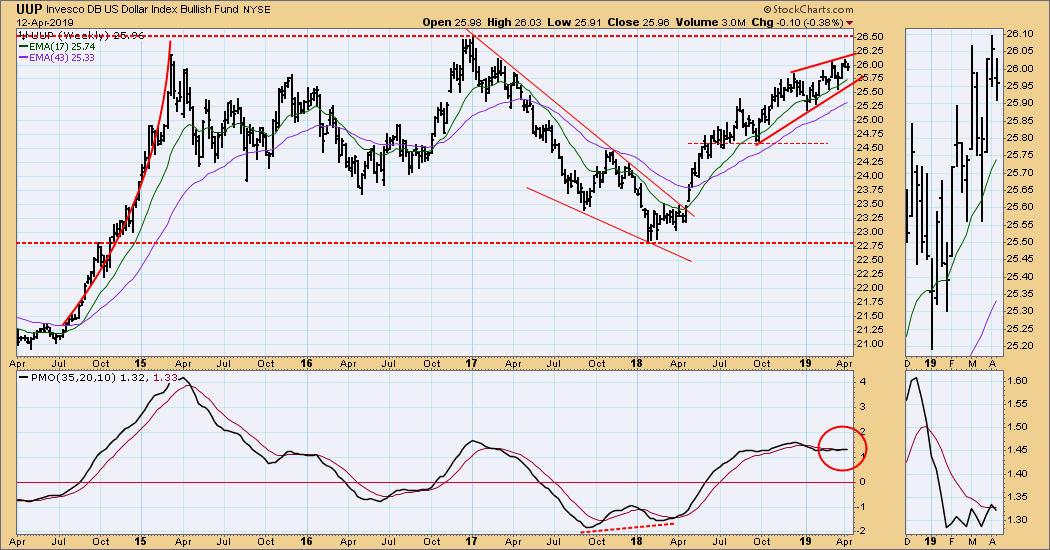
UUP Weekly Chart: A bearish rising wedge is approaching long-term overhead resistance, making it more likely, in my opinion, that the wedge will break down.
GOLD
IT Trend Model: BUY as of 10/19/2018
LT Trend Model: BUY as of 1/8/2019
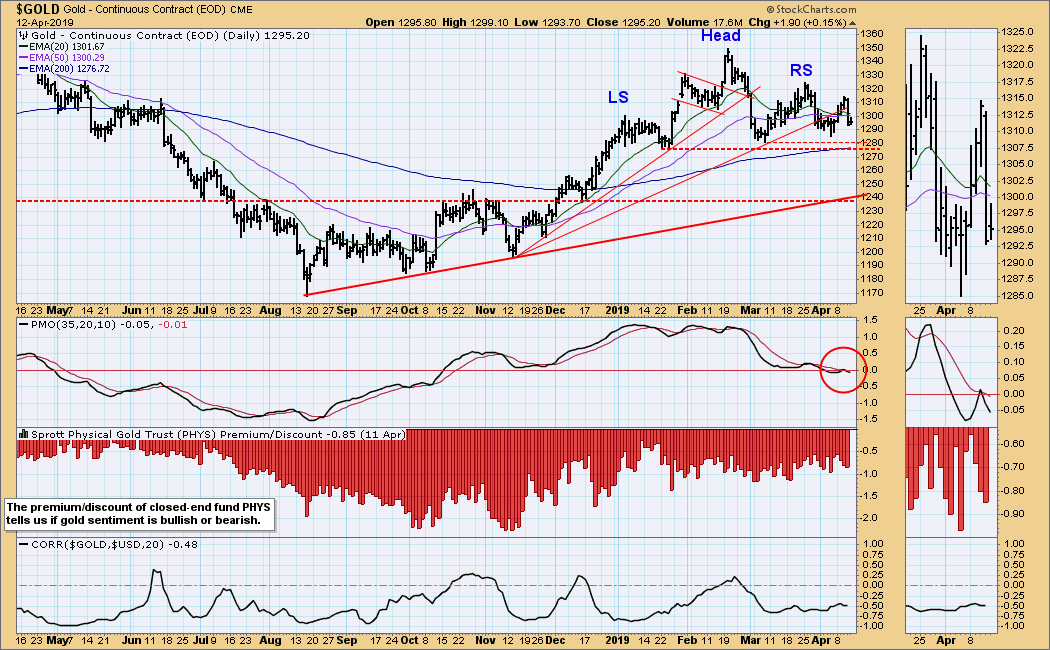
GOLD Daily Chart: There is clearly the dynamic of a head and shoulders pattern at work, although the right shoulder is getting to be somewhat complex. The daily PMO has topped and is below the signal line.
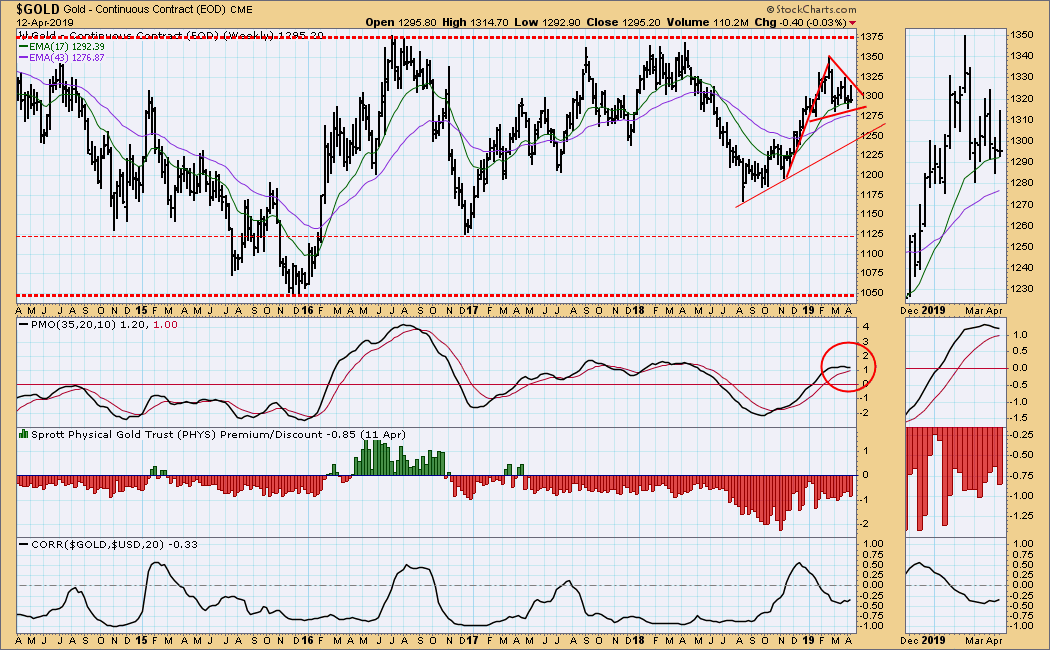
GOLD Weekly Chart: Gold remains near the top of a long-term trading range, and the weekly PMO has topped; however, price has formed a bullish pennant, so a positive outcome may be possible.
CRUDE OIL (USO)
IT Trend Model: BUY as of 2/19/2019
LT Trend Model: SELL as of 11/23/2018
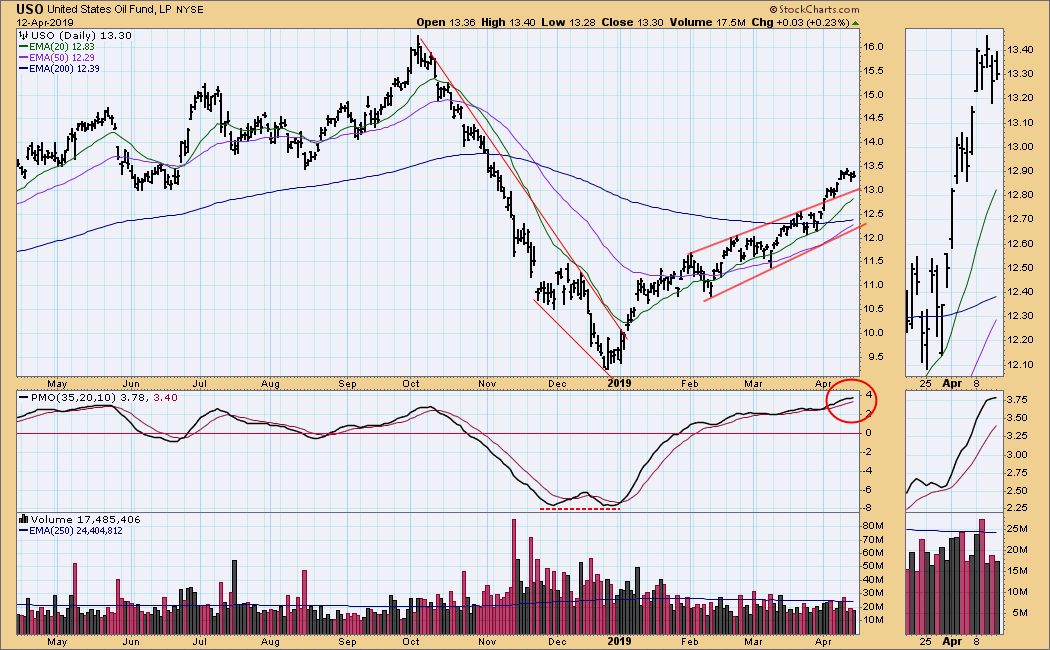
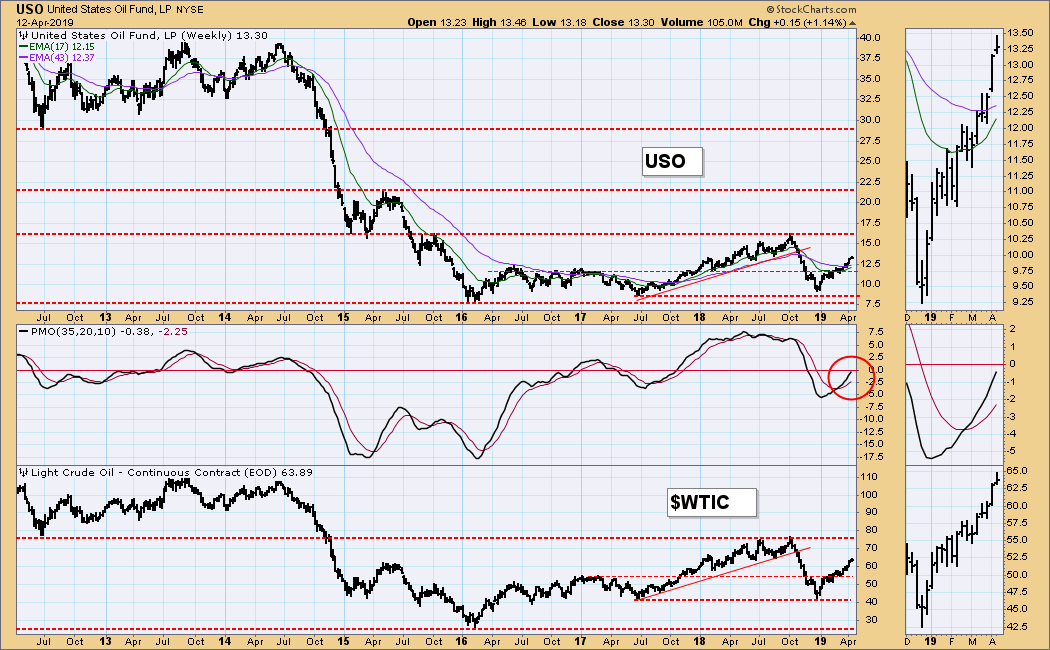
USO Daily Chart: On Monday USO continued last week's breakout, then it entered a holding pattern the rest of the week. The daily PMO is at the top of a long-term range and is very overbought.
USO Weekly Chart: I still think that last year's high of 76 will be the upside limit of the current rally.
BONDS (TLT)
IT Trend Model: BUY as of 12/6/2018
LT Trend Model: BUY as of 1/2/2019
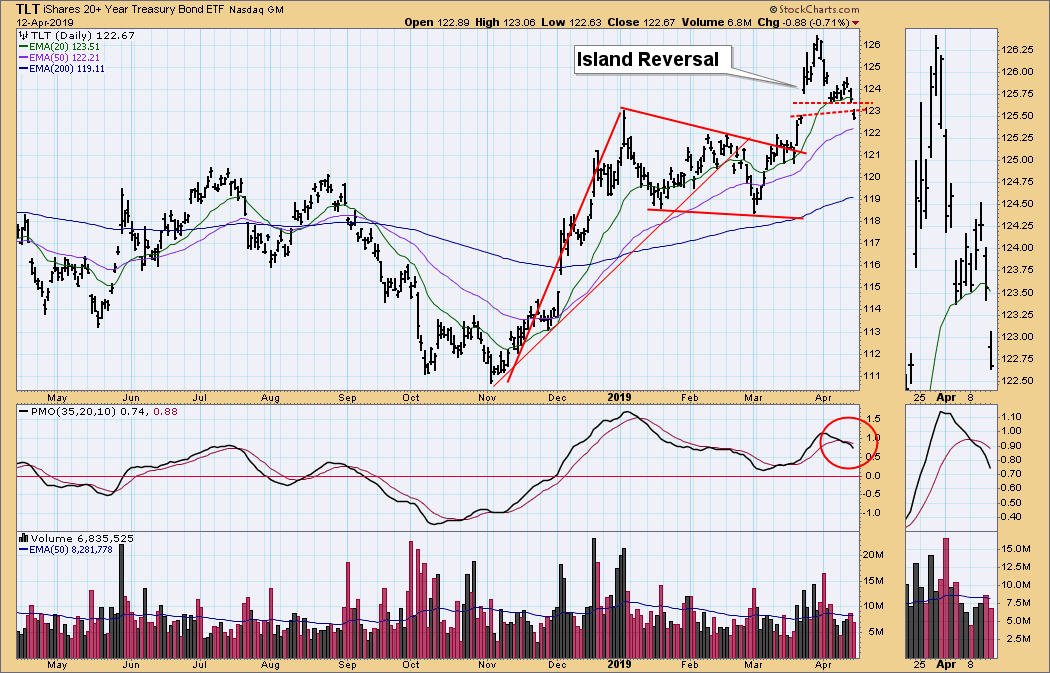
TLT Daily Chart: On afp.com it was reported Wednesday that in the Fed meeting minutes "some central bankers felt raising rates 'modestly' later in 2019 could be appropriate if the US economy continues its current expansion." This removed some of the unbridled optimism that resulted in a sharp advance in bond prices last month. In fact, it has caused an island reversal on the TLT daily chart, and the PMO has crossed down through its signal line.
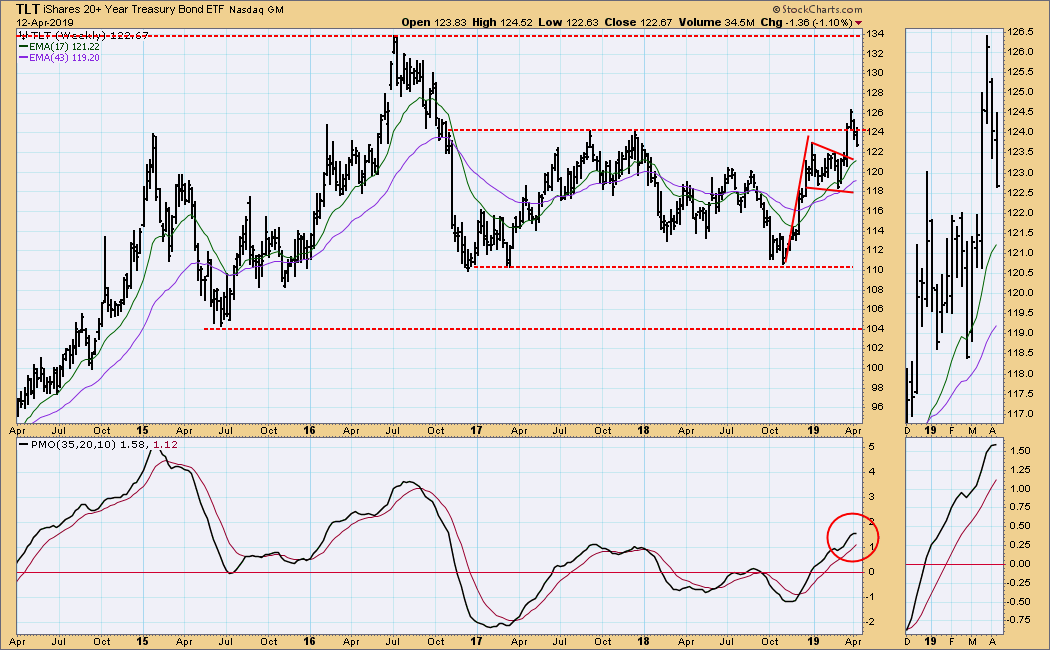
TLT Weekly Chart: The breakout of two weeks ago has failed, and the weekly PMO is topping. I think, perhaps, that price will remain in the two-year trading range for some time.
**Don't miss any of the DecisionPoint commentaries! Go to the "Notify Me" box toward the end of this blog page to be notified as soon as they are published.**
Technical Analysis is a windsock, not a crystal ball.
Happy Charting!
- Carl
NOTE: The signal status reported herein is based upon mechanical trading model signals, specifically, the DecisionPoint Trend Model. They define the implied bias of the price index based upon moving average relationships, but they do not necessarily call for a specific action. They are information flags that should prompt chart review. Further, they do not call for continuous buying or selling during the life of the signal. For example, a BUY signal will probably (but not necessarily) return the best results if action is taken soon after the signal is generated. Additional opportunities for buying may be found as price zigzags higher, but the trader must look for optimum entry points. Conversely, exit points to preserve gains (or minimize losses) may be evident before the model mechanically closes the signal.
Helpful DecisionPoint Links:
DecisionPoint Shared ChartList and DecisionPoint Chart Gallery
Price Momentum Oscillator (PMO)
Swenlin Trading Oscillators (STO-B and STO-V)

