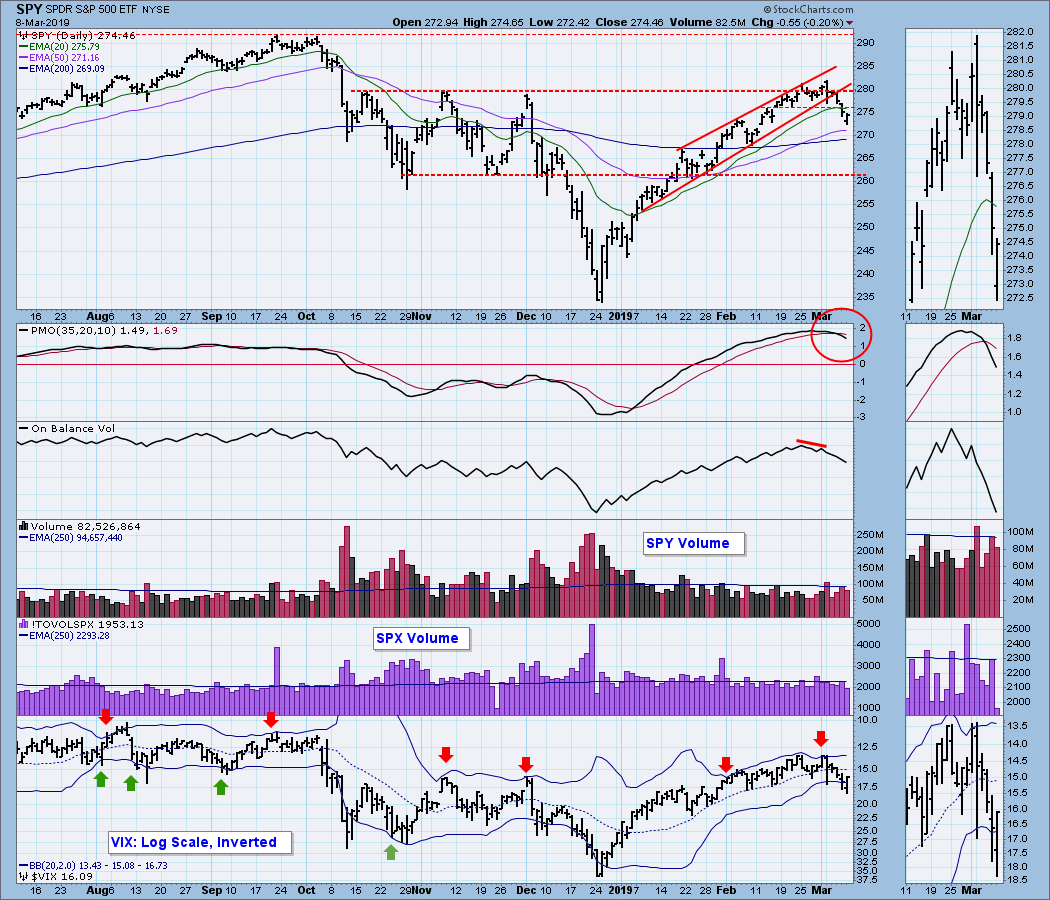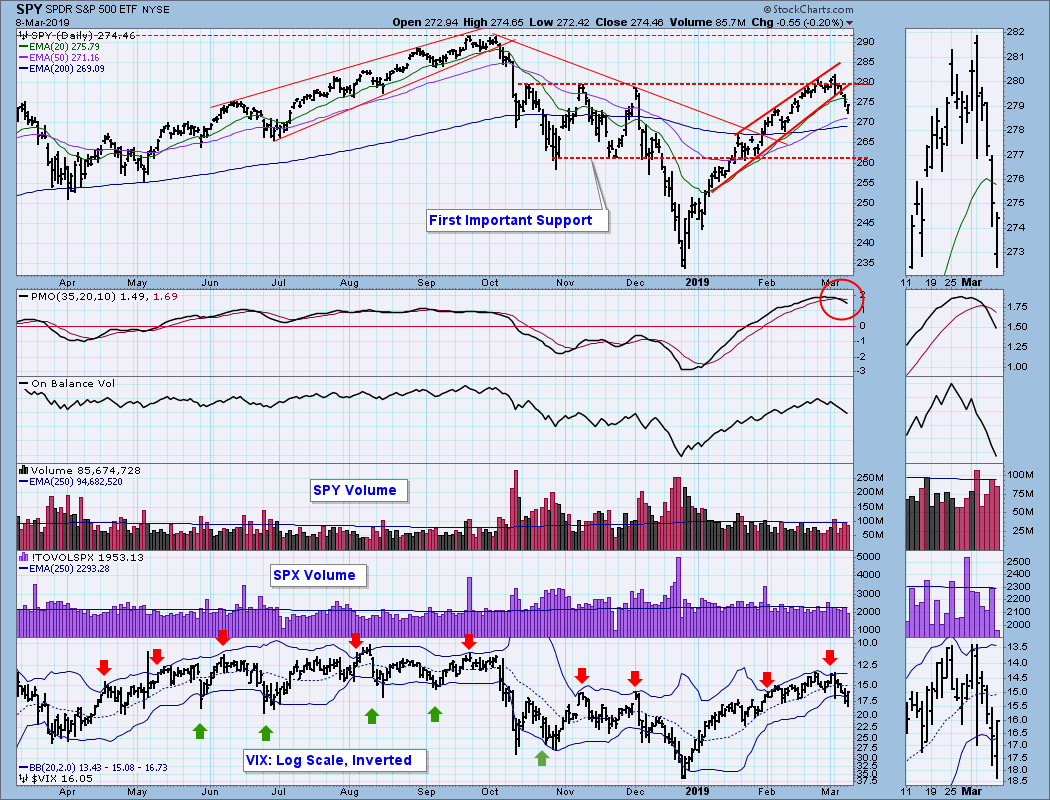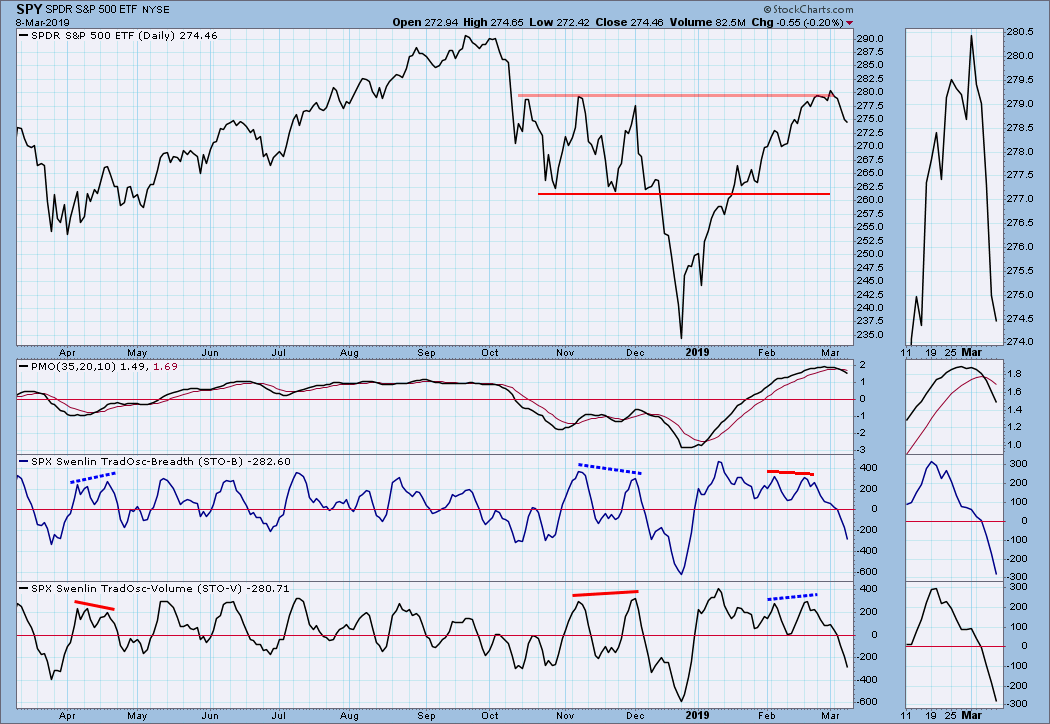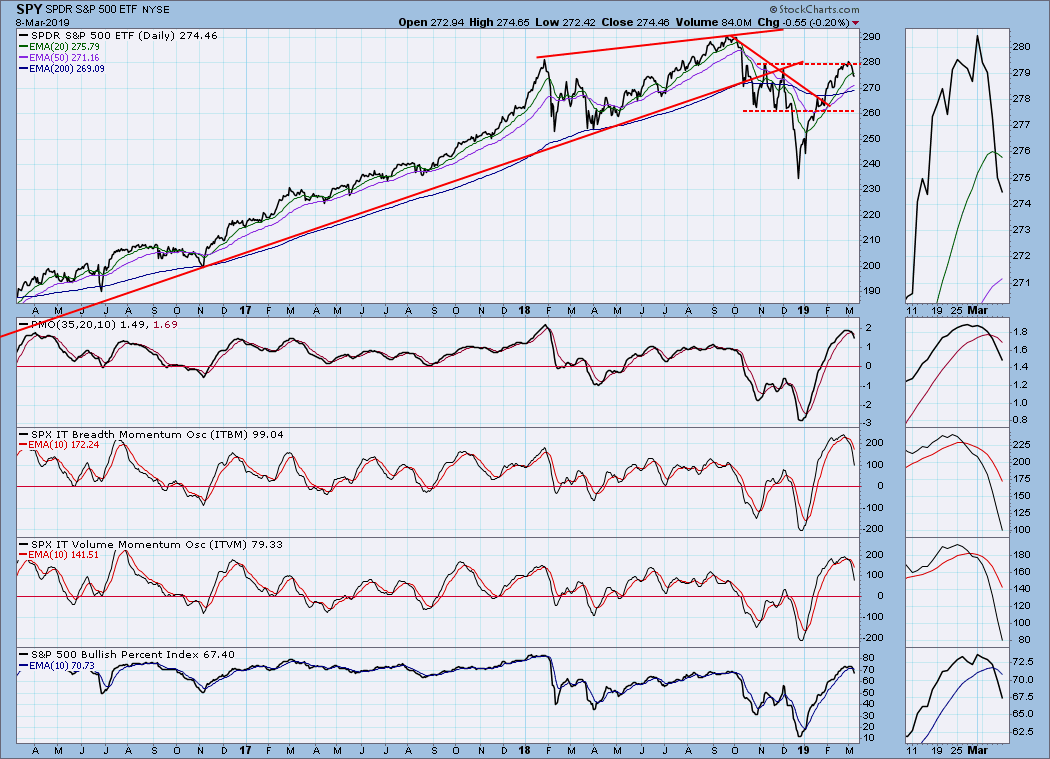
It took over two weeks, but the market top we've been looking for finally materialized. Price broke down through a rising bottoms line that goes back to the beginning of January. Also violated was the bottom of the trading range that has lasted over two weeks. At very overbought levels, the daily PMO finally topped and crossed down through the signal line. I am assuming that this is the beginning of a move that could possibly retest the December lows, but more clarification on that later.
The DecisionPoint Weekly Wrap presents an end-of-week assessment of the trend and condition of the stock market (S&P 500), the U.S. Dollar, Gold, Crude Oil, and Bonds.
Watch the latest episode of DecisionPoint on StockCharts TV's YouTube channel here!
SECTORS
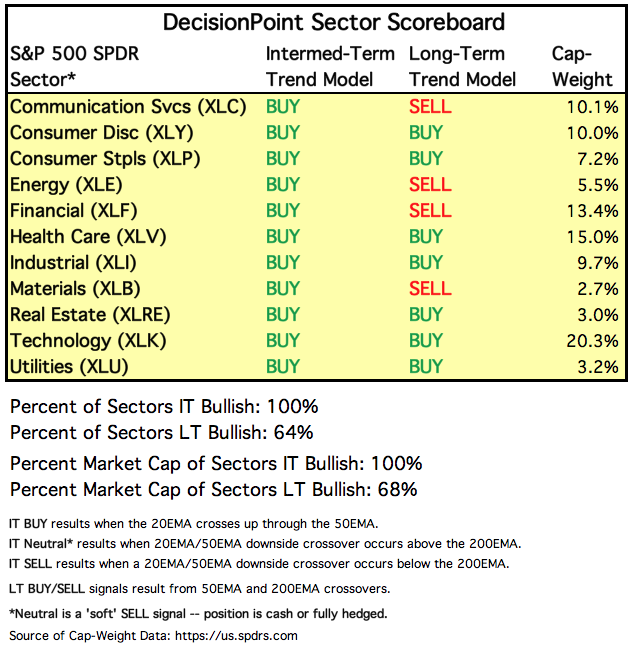
Each S&P 500 Index component stock is assigned to one, and only one, of 11 major sectors. This is a snapshot of the Intermediate-Term and Long-Term Trend Model signal status for those sectors.
STOCKS
IT Trend Model: BUY as of 2/1/2019
LT Trend Model: BUY as of 2/26/2019
SPY Daily Chart: As I said above, I think that the market has started a move toward a possible retest of the December lows. Frankly, I don't think that a decline all the way back to the December lows is likely, but we shall see. The first obvious line of support is around SPY 263 (SPX 2630). The top of the consolidation from October to early-December set a line of resistance that stopped the rally in its tracks for two weeks, and the bottom of that consolidation gives us an important line of support. Because the bottom of the consolidation is so ragged, you may wonder why I put the line where I did. If you switch the chart from bars to a line, you'll see that the support line is set across three important closing lows.
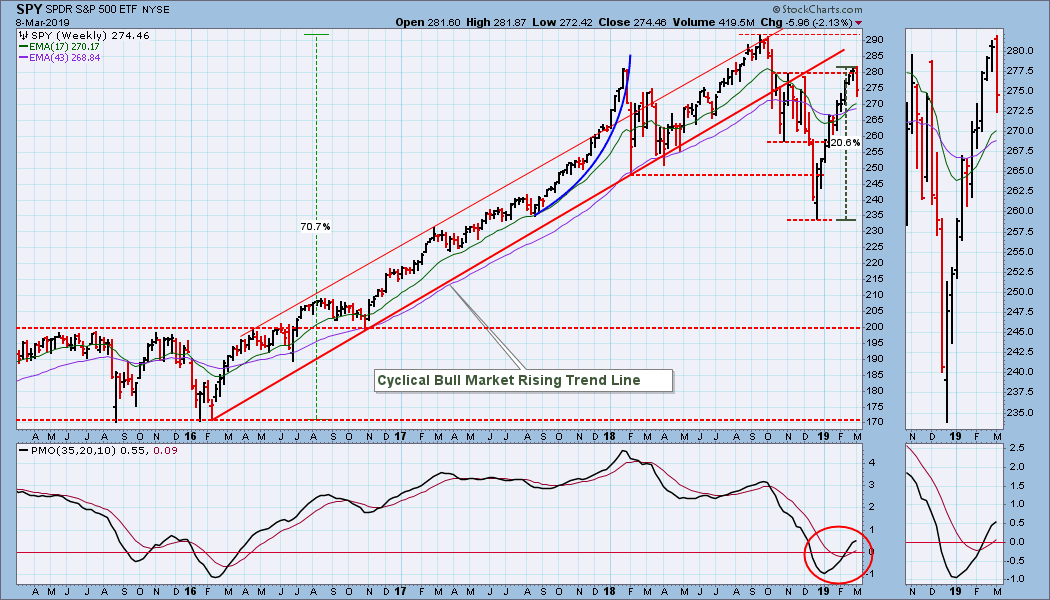
SPY Weekly Chart: This was the worst week since the rally started in December. Note that the weekly PMO is trying to roll over.
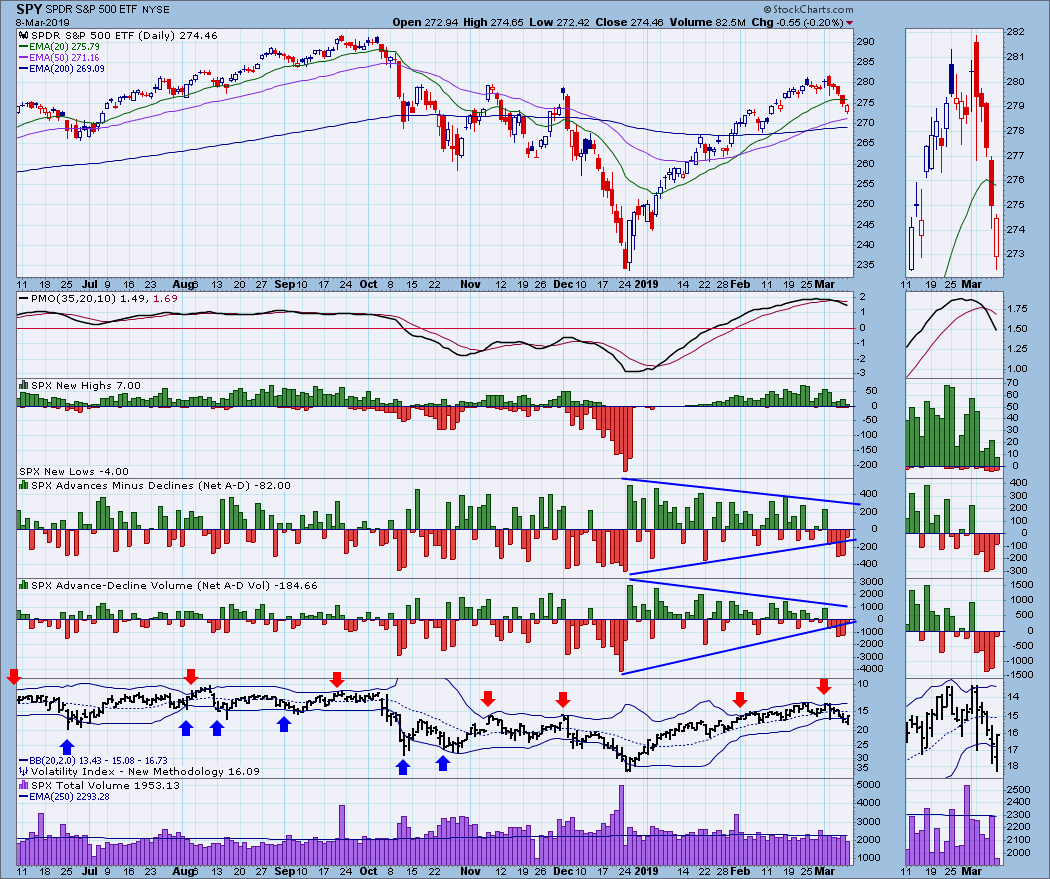
Climactic Market Indicators: Net breadth and volume was narrowing until this week when the trends broke downward. The VIX touched the top Bollinger Band, telling us to look for a price top. The VIX has already reached the bottom Bollinger Band, but I'm looking for volatility to increase, resulting in the bottom band being pushed lower.
Short-Term Market Indicators: The STO-B and STO-V are oversold. Let's watch to see what kind of response this gets us. If we don't get a short bounce, it could mean that the bear is waking up again.
Intermediate-Term Market Indicators: Still a long way to go before these indicators are oversold.
CONCLUSION: The market is in the process of the largest pullback since the December lows (about -3.5% from the march high to today's low). Yeah, not a very big deal, is it. The topping process has taken almost three weeks, and so far the market has been very stingy with the selling it has done -- I do not get the impression that the bottom is going to fall out. Nevertheless, it has been some time since we have seen reasonably significant corrective action, and I will be looking for a decline back to the line of support (2630 for the S&P 500; 263 for SPY), which would be about a -7% pullback from this month's high. Once (IF) that happens, we'll consider what might be the next most likely move. I don't see this as a shorting opportunity, and we need to see how this decline will resolve before opening new long positions.
Next week is an options expiration week, and since it is occurring at the end of the quarter, we should expect volume to be very high on Friday. I always make mention of this because, if you pay a lot of attention to volume, you don't want to attribute the high volume to any news items that may surface at the end of the week. It's just options expiration.
DOLLAR (UUP)
IT Trend Model: BUY as of 2/7/2019
LT Trend Model: BUY as of 5/25/2018
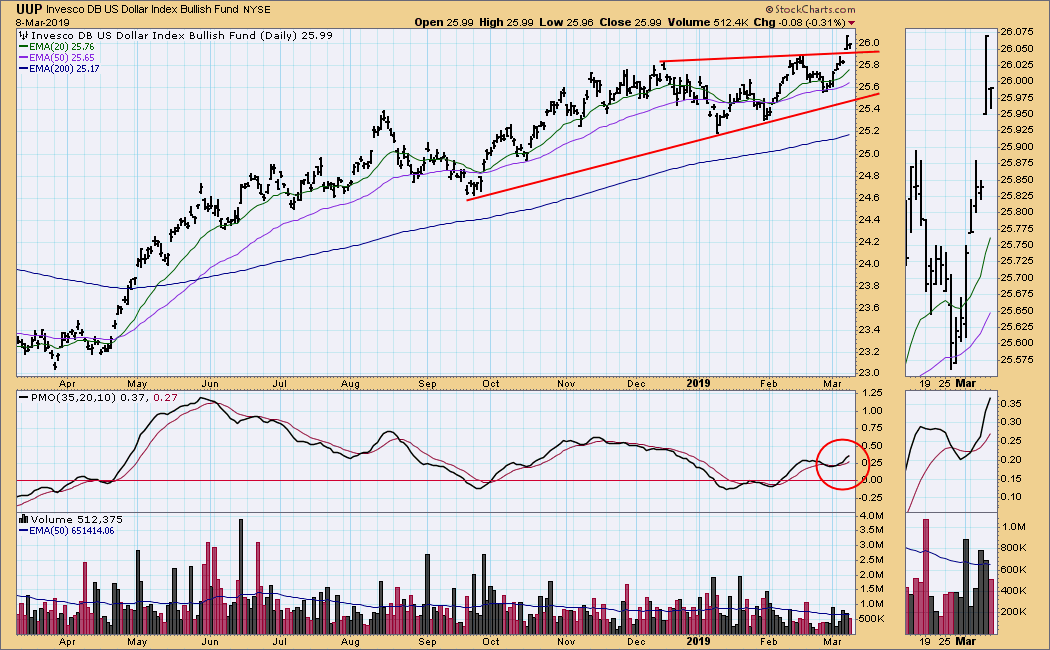
UUP Daily Chart: The dollar had a huge rally on Thursday, breaking out of a rising wedge formation. Price retreated on Friday, but the breakout was maintained.
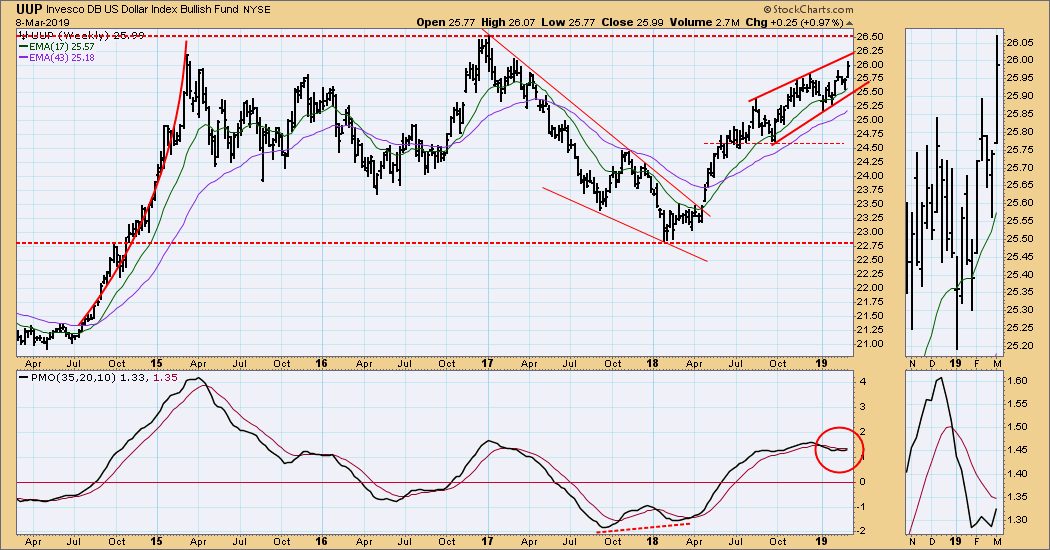
UUP Weekly Chart: There is a longer-term rising wedge in this time frame. It is not especially tight, and the weekly PMO has bottomed, so an upside breakout may be in the cards.
GOLD
IT Trend Model: BUY as of 10/19/2018
LT Trend Model: BUY as of 1/8/2019
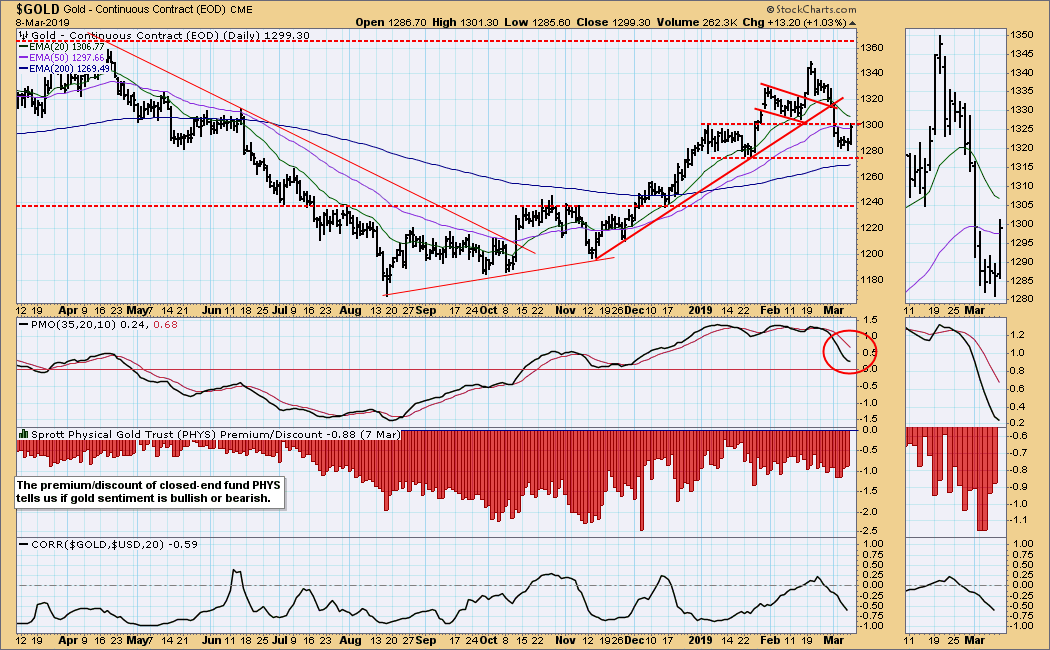
GOLD Daily Chart: Last week gold broke below a rising trend line, giving the impression that a pullback was beginning. The first four days this week that impression was reinforced as gold consolidated, forming a bearish reverse flag. On Thursday the dollar rallied about +1%. We could have expected gold to decline a similar amount, but it held fast. On Friday gold rallied out of the reverse flag formation, giving the impression that the pullback could be over.
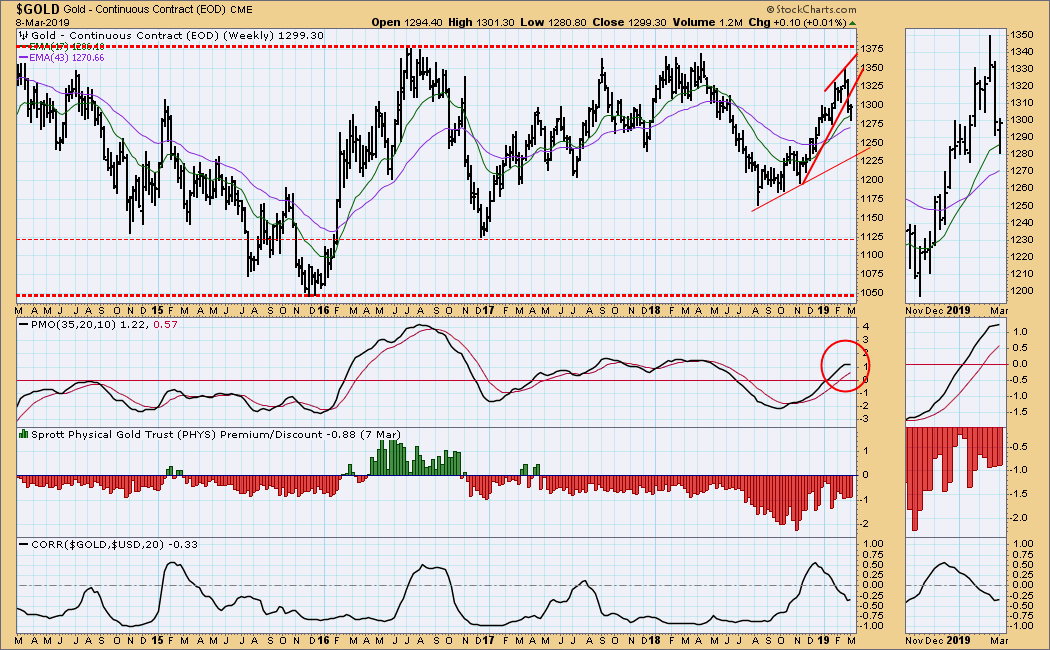
GOLD Weekly Chart: In this time frame we can see that gold broke down from a rising wedge formation. The decline extended this week, but gold closed near the top of this week's range, so the pullback may be over.
CRUDE OIL (USO)
IT Trend Model: BUY as of 2/19/2019
LT Trend Model: SELL as of 11/23/2018
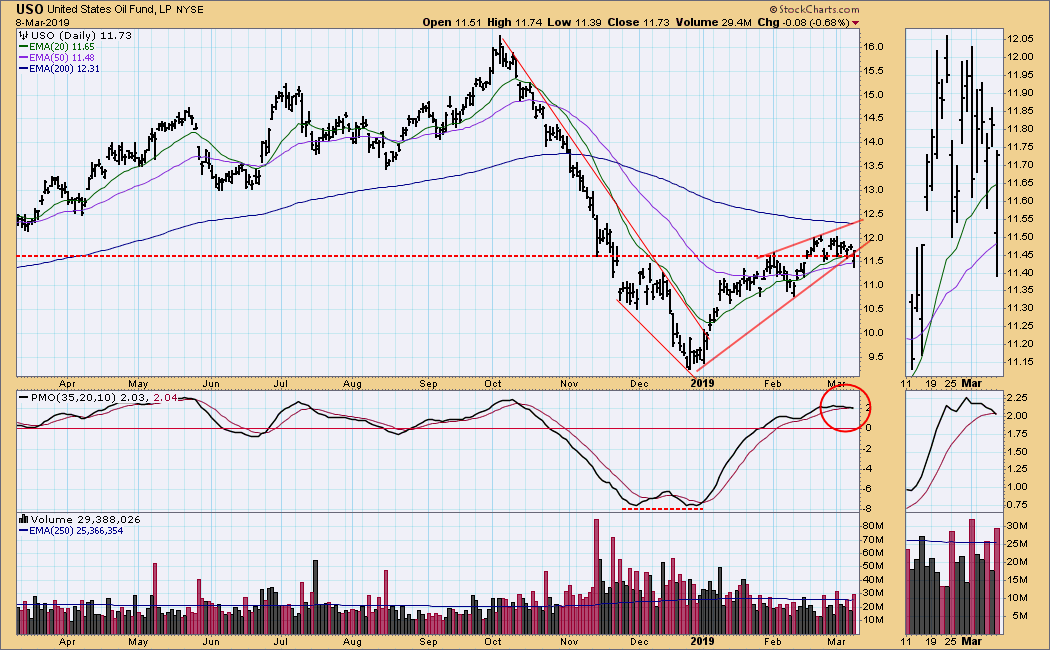
USO Daily Chart: For a while I thought that USO had a reverse head and shoulders going, but the price action of the last two weeks failed to stick with that scenario, and I have identified a rising wedge instead. Whereas the reverse head and shoulders had implied future higher prices, the bearish wedge implies the opposite. In that spirit USO broke down from the wedge in Friday, but it closed right on the rising trend line.
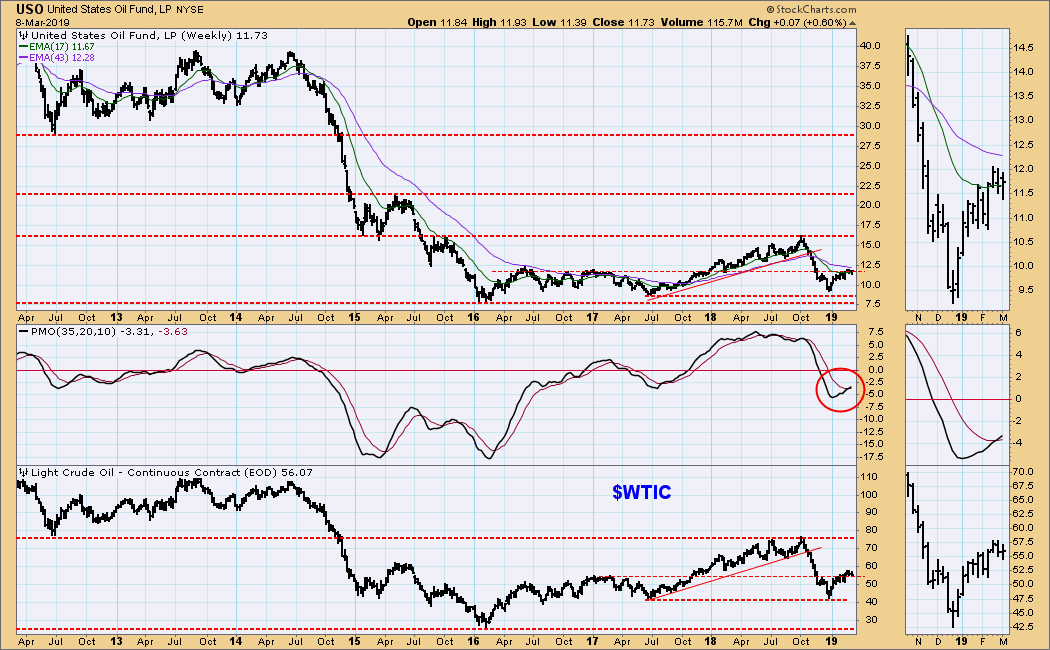
USO Weekly Chart: In this time frame we can see the potential for a WTIC move to 76, but based upon what's happening on the daily chart, I think that is unlikely.
BONDS (TLT)
IT Trend Model: BUY as of 12/6/2018
LT Trend Model: BUY as of 1/2/2019
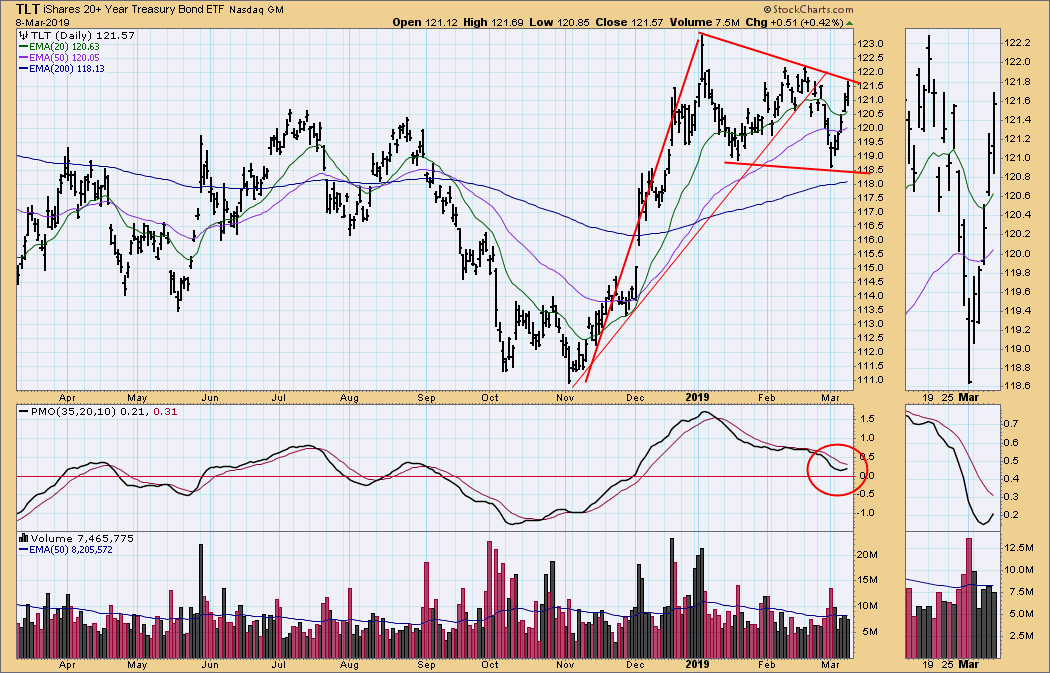
TLT Daily Chart: From bearish to bullish in the blink of an eye. Last week we had a bearish Adam and Eve double top with price dropping below the confirmation line, but this week's rally makes a bullish falling wedge the most obvious formation now. The wedge could also be interpreted as a flag formation, also bullish. The daily PMO has bottomed.
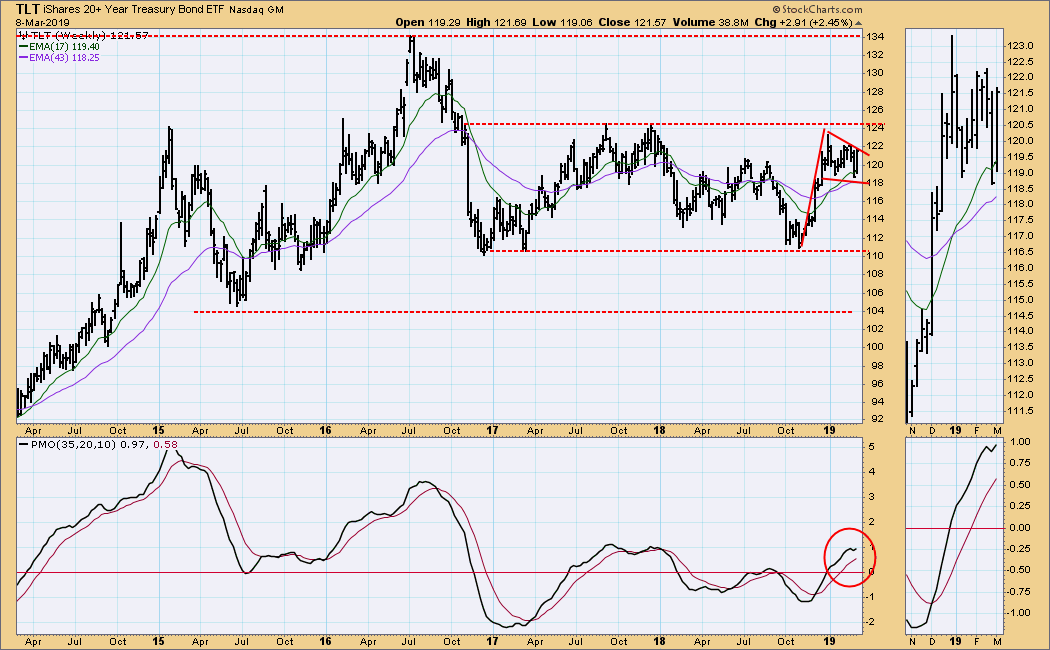
TLT Weekly Chart: The weekly PMO has turned back up, and there is still room to go higher before long-term resistance comes into play. If the flag persists and delivers, the 2016 top could be challenged.
**Don't miss any of the DecisionPoint commentaries! Go to the "Notify Me" box toward the end of this blog page to be notified as soon as they are published.**
Technical Analysis is a windsock, not a crystal ball.
Happy Charting!
- Carl
NOTE: The signal status reported herein is based upon mechanical trading model signals, specifically, the DecisionPoint Trend Model. They define the implied bias of the price index based upon moving average relationships, but they do not necessarily call for a specific action. They are information flags that should prompt chart review. Further, they do not call for continuous buying or selling during the life of the signal. For example, a BUY signal will probably (but not necessarily) return the best results if action is taken soon after the signal is generated. Additional opportunities for buying may be found as price zigzags higher, but the trader must look for optimum entry points. Conversely, exit points to preserve gains (or minimize losses) may be evident before the model mechanically closes the signal.
Helpful DecisionPoint Links:
DecisionPoint Shared ChartList and DecisionPoint Chart Gallery
Price Momentum Oscillator (PMO)
Swenlin Trading Oscillators (STO-B and STO-V)

