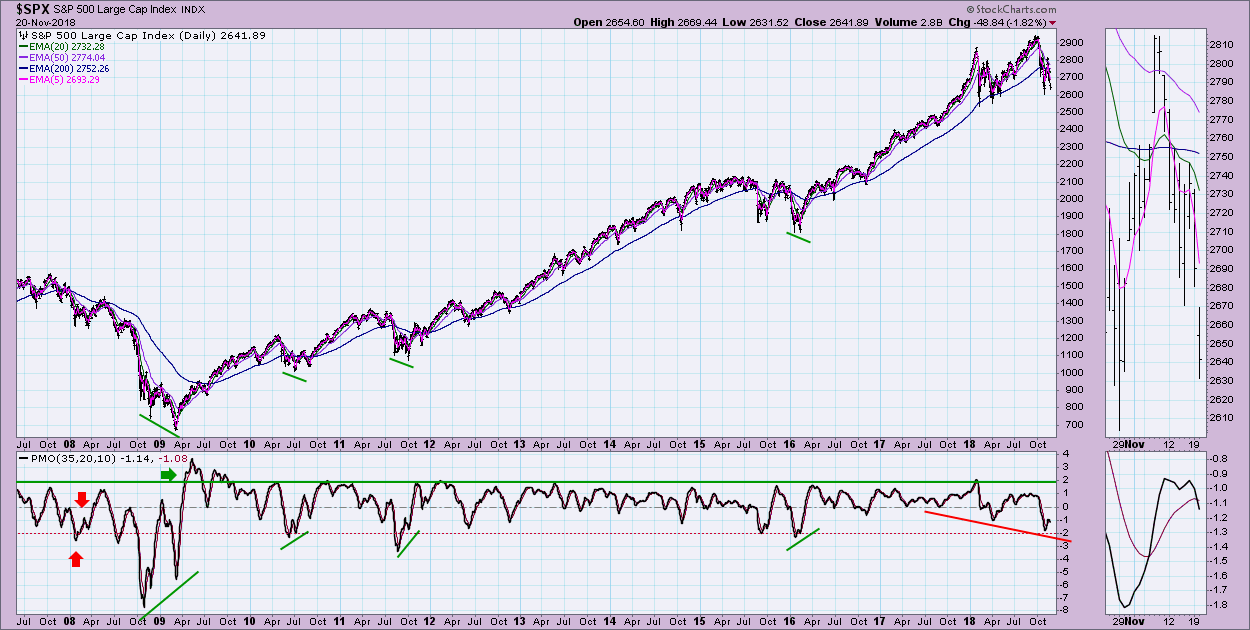
The Price Momentum Oscillators (PMOs) seem to have a few unusual characteristics in the period before bear markets. I believe that the current PMO set-up on the SPX is dangerously close to mimicking those bear market preludes. I decided to do a historical study when I noticed all four DP Scoreboard indexes had PMO tops below the zero line after a very oversold reading. This is just "eyeballing" the previous bear markets on the charts and discovering similarities.
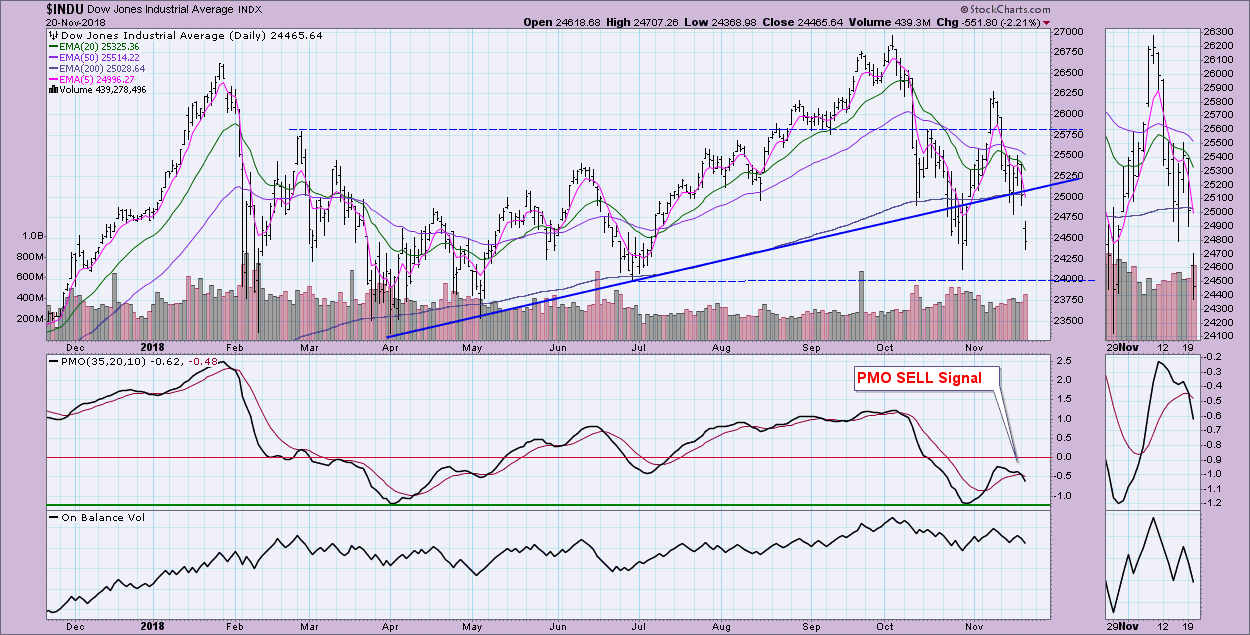
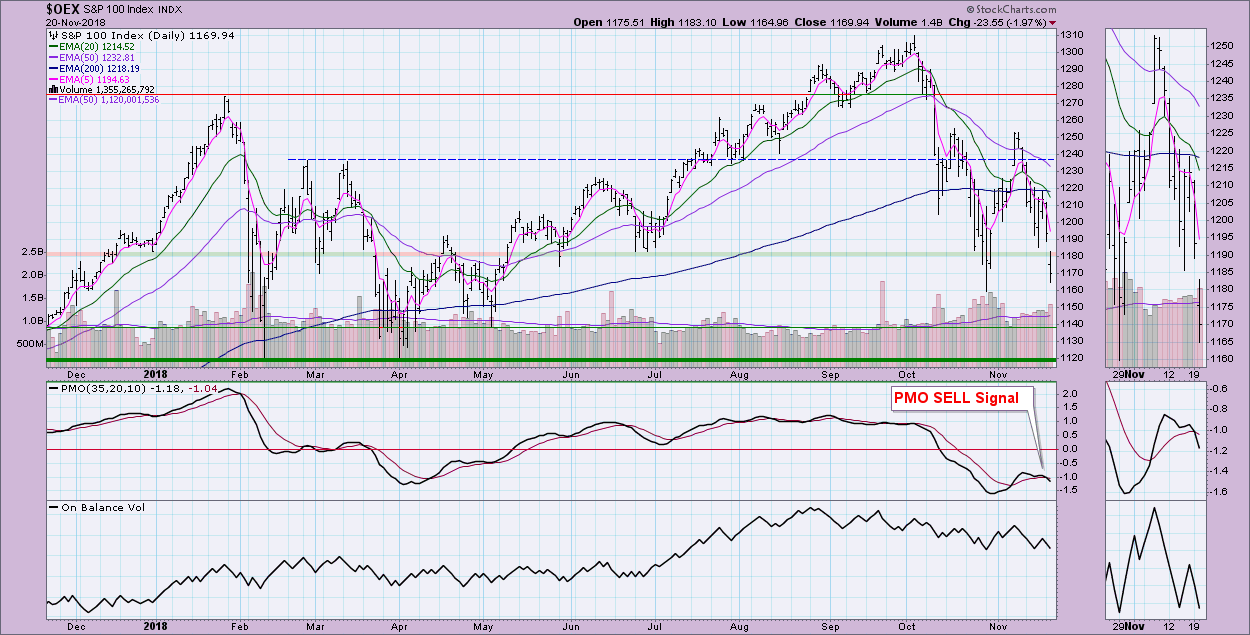
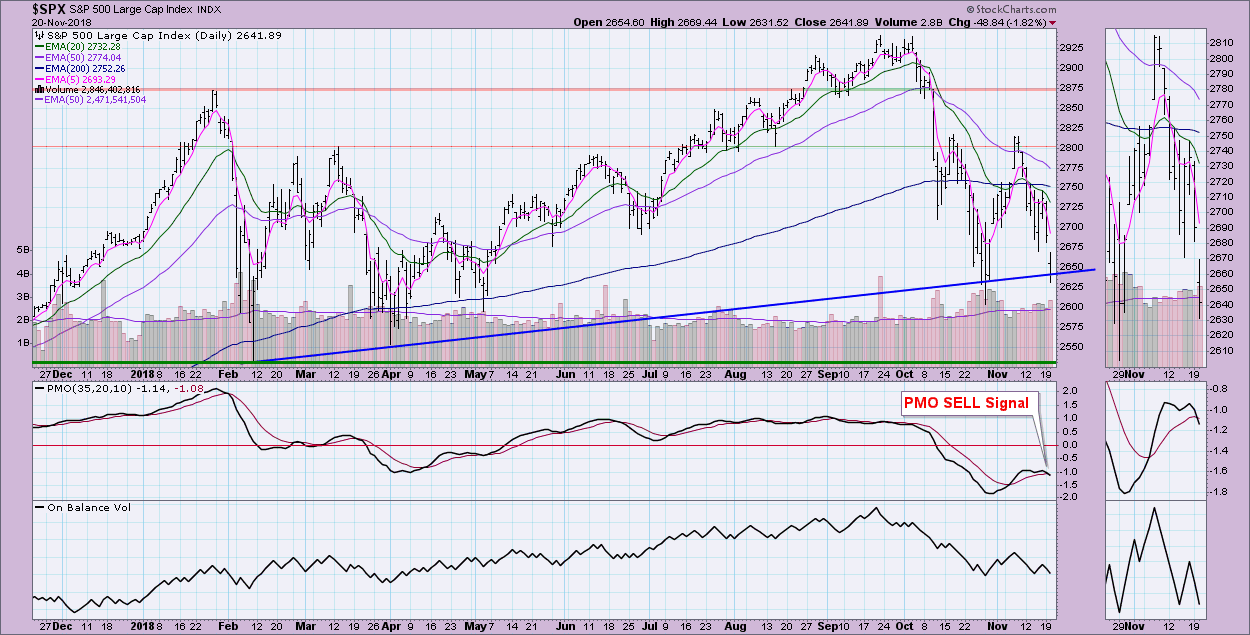
Let's start with the three new PMO SELL signals that appeared on the DecisionPoint Scoreboard Summary. The SPX, OEX and Dow all join the NDX with PMO SELL signals in the short term. These signals are derived from PMO crossovers on the daily charts.
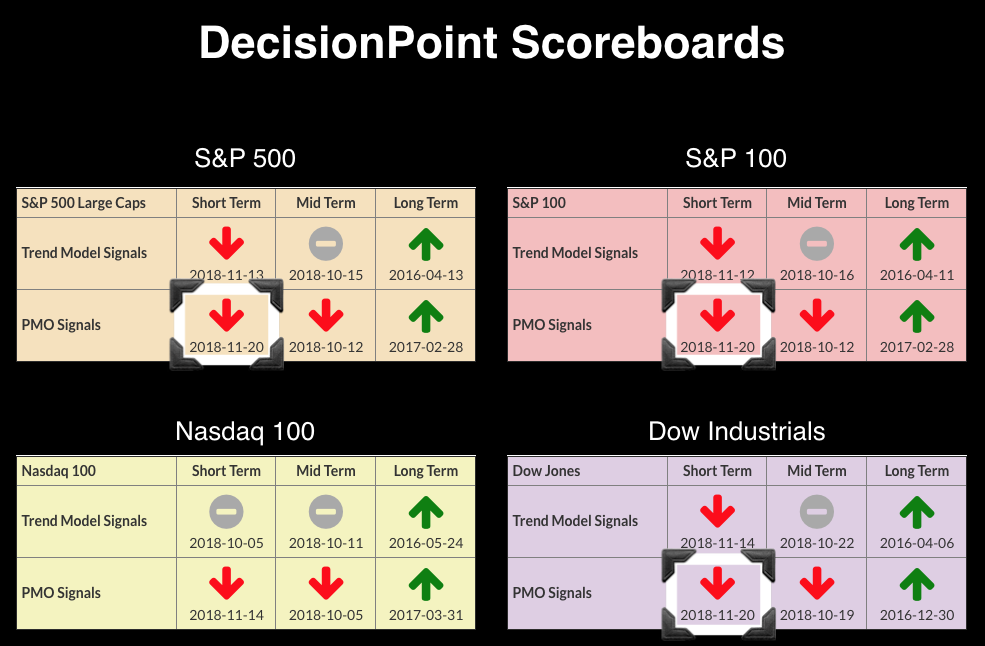
Below are the daily charts of the three. Notice that all hit very oversold territory and then after bouncing, have turned down well-below the zero line. This is one of the characteristics of the PMO before bear markets.
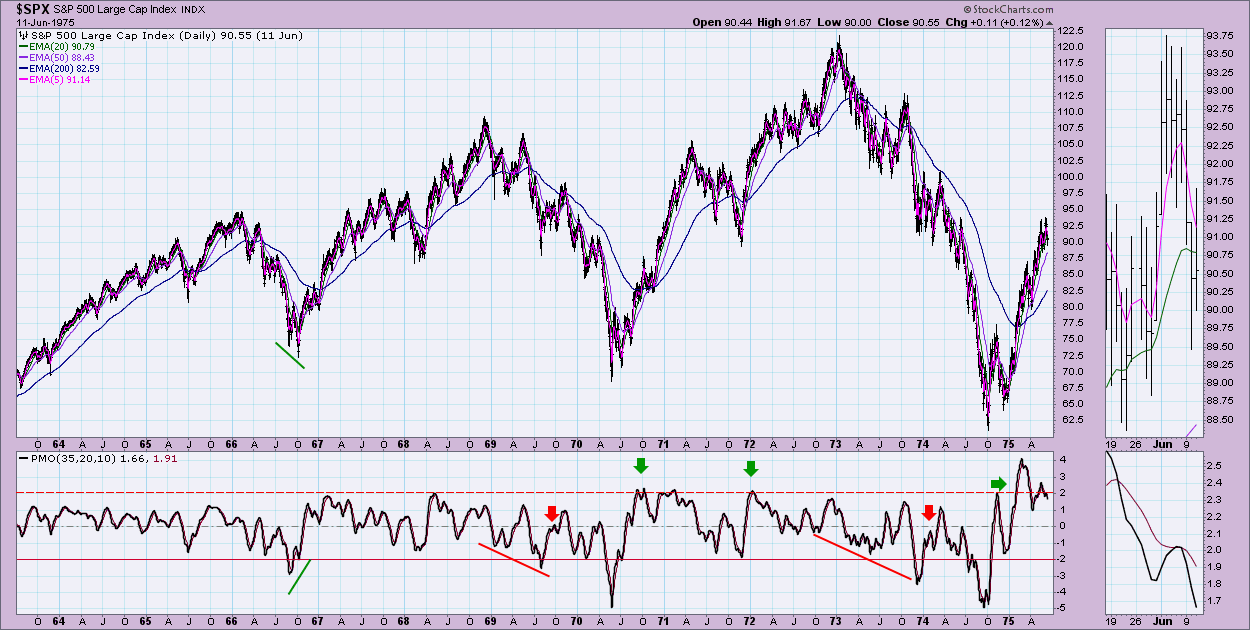
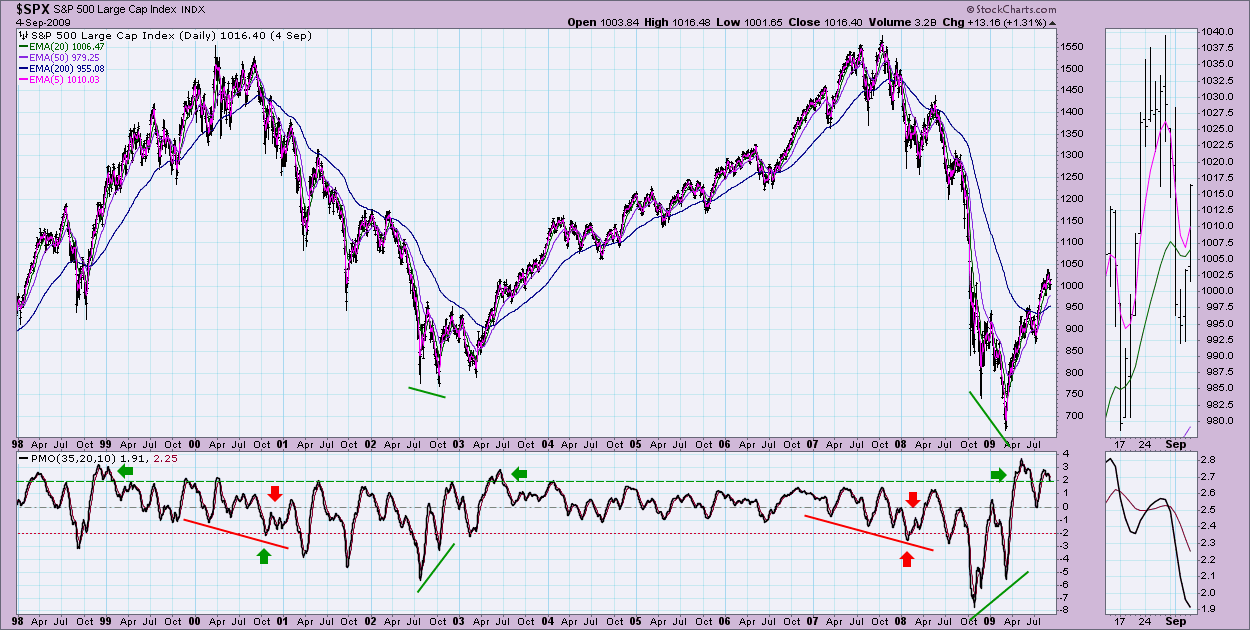
Alright, below I've got three long-term daily charts that cover four bear markets. What I've found is that the PMO on the SPX gets down below -2 and then on its return back up, it tops and produces a SELL signal below the zero line. I also note that major PMO bottoms continually move lower and lower. It isn't until we see moves into overbought territory (above +2) that a bull market begins again. Like I said, I'm eyeballing this. Looking back at bear markets in 1969 and 1972, you can see the similarities. I do note that 1966 did not show a similar PMO setup, but the correction/bear market ended on a positive divergence with the PMO.
Below are the 2000 and 2008 bear markets. The setup is there. Note in 2001 until the end of the bear market, the PMO major lows continued to move lower and lower. The end of these bear markets were punctuated by positive divergences with the PMO and price bottoms.
 Below is today's chart. I think there are unfortunate similarities to the start of previous bear markets. Notice when we got "fake outs" of oversold readings, they became part of a positive divergence with price lows. That's exactly what I'll be looking for in the coming week or weeks.
Technical Analysis is a windsock, not a crystal ball.
Happy Charting!
- Erin
Helpful DecisionPoint Links:
DecisionPoint Shared ChartList and DecisionPoint Chart Gallery
Price Momentum Oscillator (PMO)
Swenlin Trading Oscillators (STO-B and STO-V)
**Don't miss DecisionPoint Commentary! Add your email below to be notified of new updates"**

