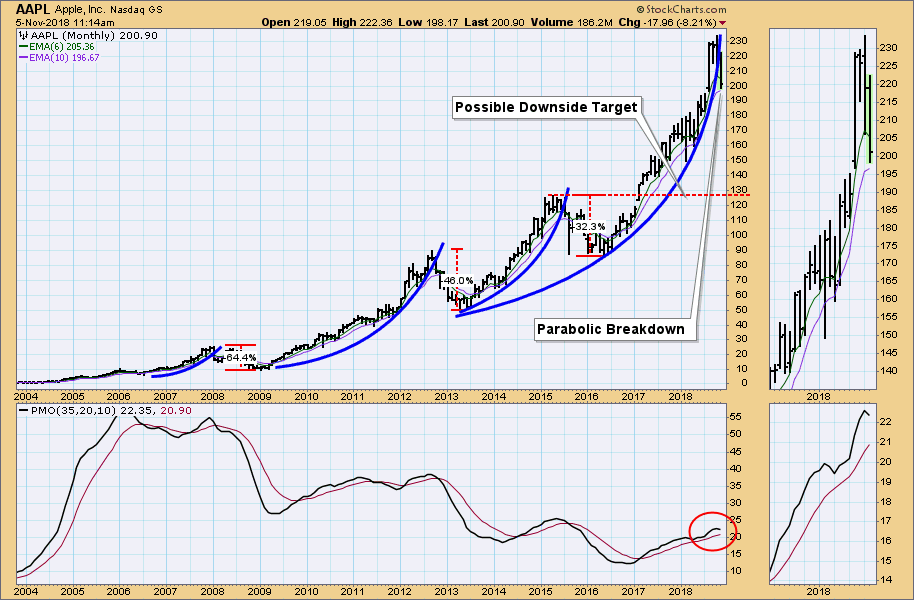
Apple, Inc. (AAPL) is nothing if not repetitive. AAPL experiences frenzied, parabolic advances that are followed by equally dramatic corrections. This has happened no less than three times in the last 11 years with an average correction of -48%. Now it appears to be happening again, as price has recently broken down through the most recent parabolic arc. To me the most obvious downside target is about 127, a decline of about -45%. As a technical target it looks reasonable, and it falls in line with the magnitude of previous corrections.
Caveat: This is a monthly chart and the last bar won't be final until the end of this month. But wait, you say, the parabolic arc has been broken! This is true, but before the end of the month price could reverse upward and take out the recent all-time highs, at which point I would have to redraw the arc to accommodate the recent decline. Nevertheless, given information I have right now, my belief is that AAPL, already down about -15%, is headed for a substantial correction.
Happy Charting!
- Carl
Technical Analysis is a windsock, not a crystal ball.
**Don't miss DecisionPoint Commentary! Add your email below to be notified of new updates"**
Helpful DecisionPoint Links:
DecisionPoint Shared ChartList and DecisionPoint Chart Gallery
Price Momentum Oscillator (PMO)
Swenlin Trading Oscillators (STO-B and STO-V)

