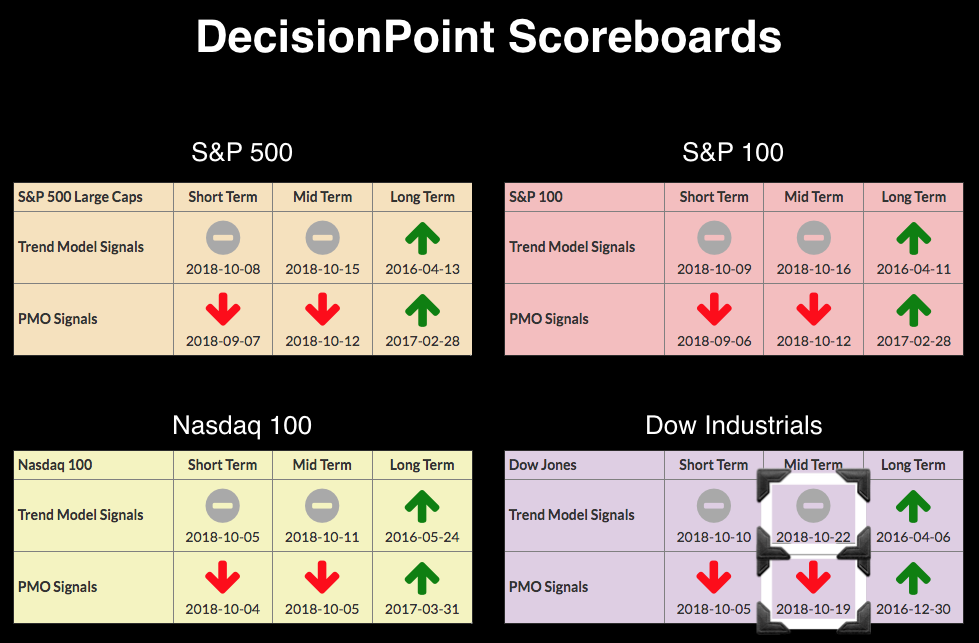
On Friday, after the market closed, the Dow saw its Price Momentum Oscillator (PMO) on the weekly chart sink below its signal line, generating an IT PMO SELL signal. Today, insult was added to injury as a new IT Trend Model Neutral signal triggered. At this point, the only "green" left on the Scoreboards are the Long-Term BUY signals.

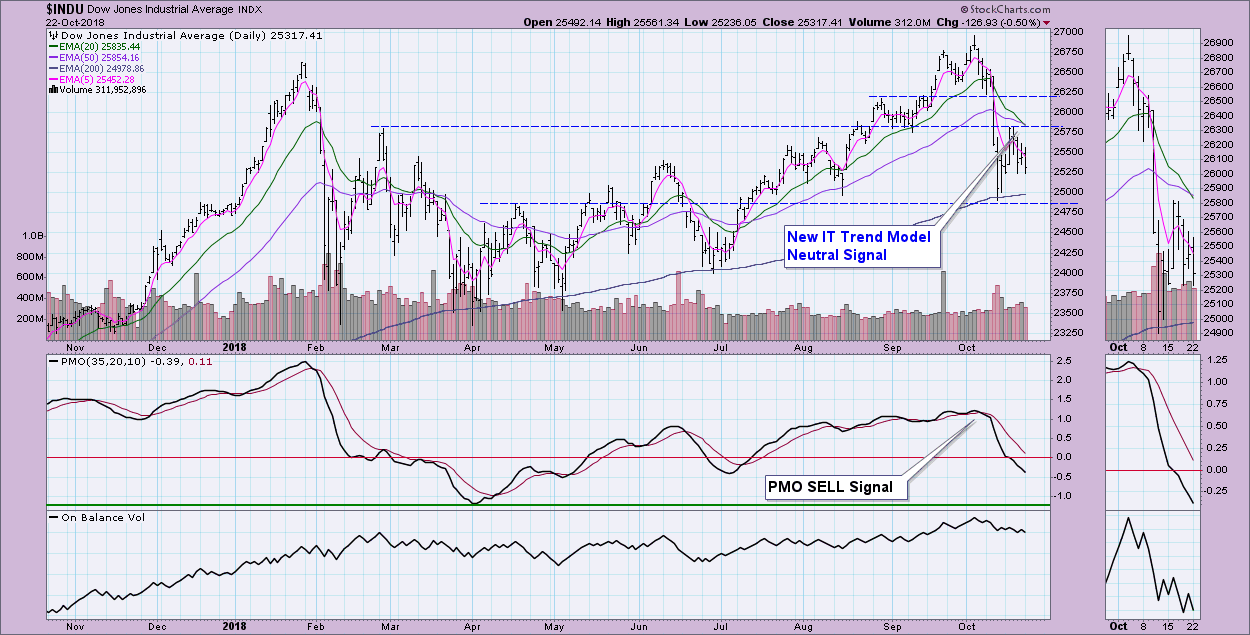
The 20-EMA dropped below the 50-EMA while the 50-EMA was well-above the 200-EMA. The IT Trend Model signal is Neutral. The PMO is falling fast, but hasn't reached oversold extremes. I suspect the 200-EMA will be tested once again.
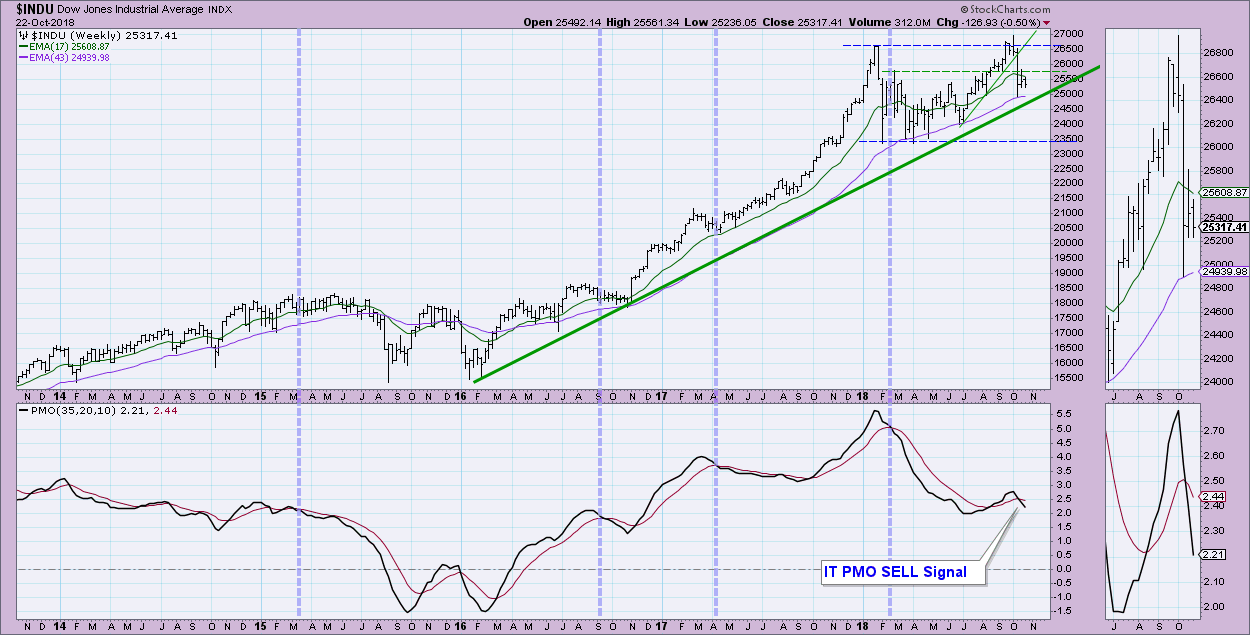
Notice on the weekly chart that the PMO had a negative crossover. That is what generated the "Intermediate-Term" PMO SELL signal. The long-term rising trend is still in place. The 43-week EMA is holding up as support. The rising bottoms trendline is also available for support.
Technical Analysis is a windsock, not a crystal ball.
Happy Charting!
- Erin
Helpful DecisionPoint Links:
DecisionPoint Shared ChartList and DecisionPoint Chart Gallery
Price Momentum Oscillator (PMO)
Swenlin Trading Oscillators (STO-B and STO-V)
**Don't miss DecisionPoint Commentary! Add your email below to be notified of new updates"**


