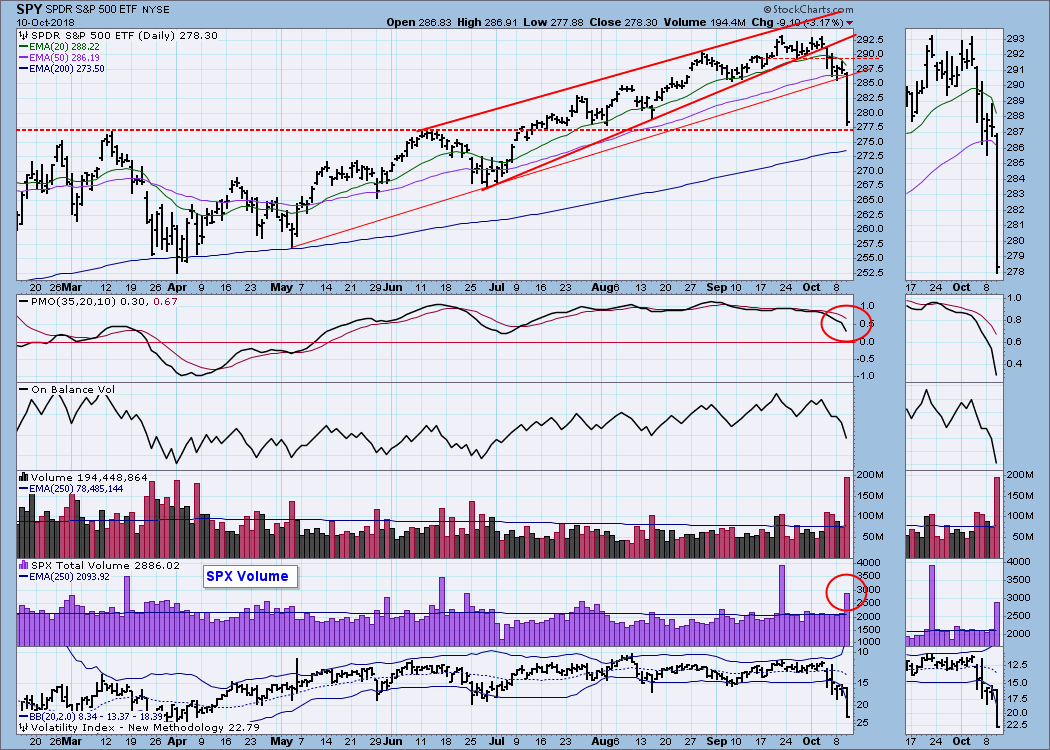
After a day like this, the first question I ask is where is support? That question is not fully answered on this daily chart, but there is something worth noting here. Volume for SPY was huge -- 248% of the 250-day average -- but SPY is a trading instrument and its volume doesn't necessarily represent the broad market. S&P 500 volume was also high, but only 138% of the average, and it is far below the volume spike of three weeks ago, when the market made its last all-time high. My point: I'm not sure that today's volume was sufficiently climactic to mark a bottom.
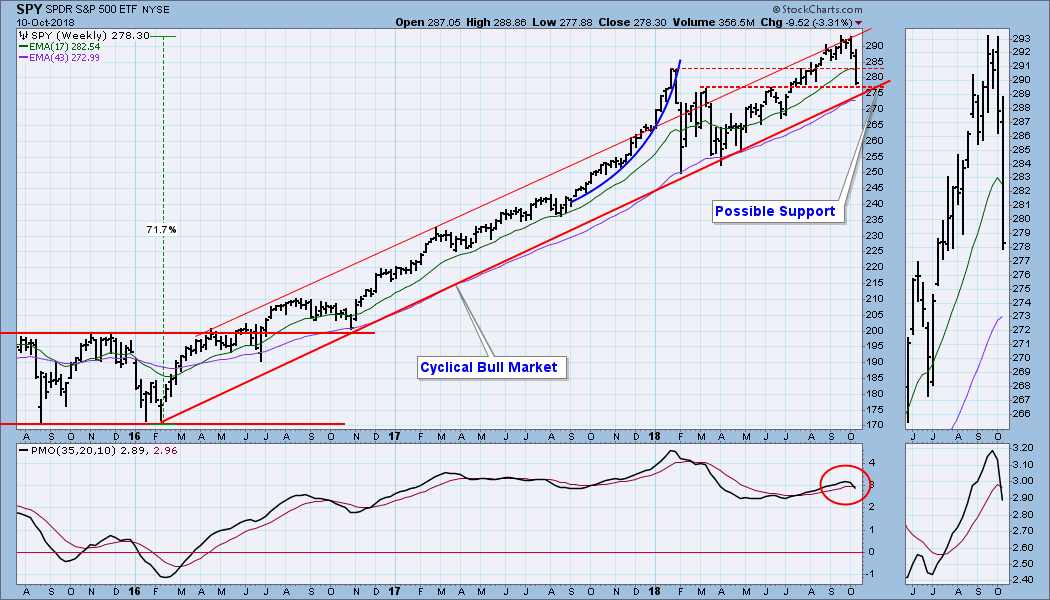
The weekly chart below gives us a better perspective. Price is approaching the horizontal support drawn across the March and June tops, but the longer-term support of the cyclical bull market rising trend line is also coming into play. In fact, the two lines intersect in about two days, so that support could be where the selling stops; however, a problem is that the weekly PMO bearish.
 CONCLUSION: Some important support is not far below. If the rising trend line is violated, I would consider that a serious problem. For those who want to try to pick a bottom, the first short-term indication that a price bottom may be near will be when the daily PMO turns up. I wouldn't jump in until that happens.
Happy Charting!
- Carl
Technical Analysis is a windsock, not a crystal ball.
**Don't miss DecisionPoint Commentary! Add your email below to be notified of new updates"**
Helpful DecisionPoint Links:
DecisionPoint Shared ChartList and DecisionPoint Chart Gallery
Price Momentum Oscillator (PMO)
Swenlin Trading Oscillators (STO-B and STO-V)

