 Today I was alerted to a new Short-Term Trend Model BUY signal on USO. This signal is triggered when the 5-EMA crosses above the 20-EMA. When I went to take a look at the chart, I noted some very bullish characteristics that I thought I'd share.
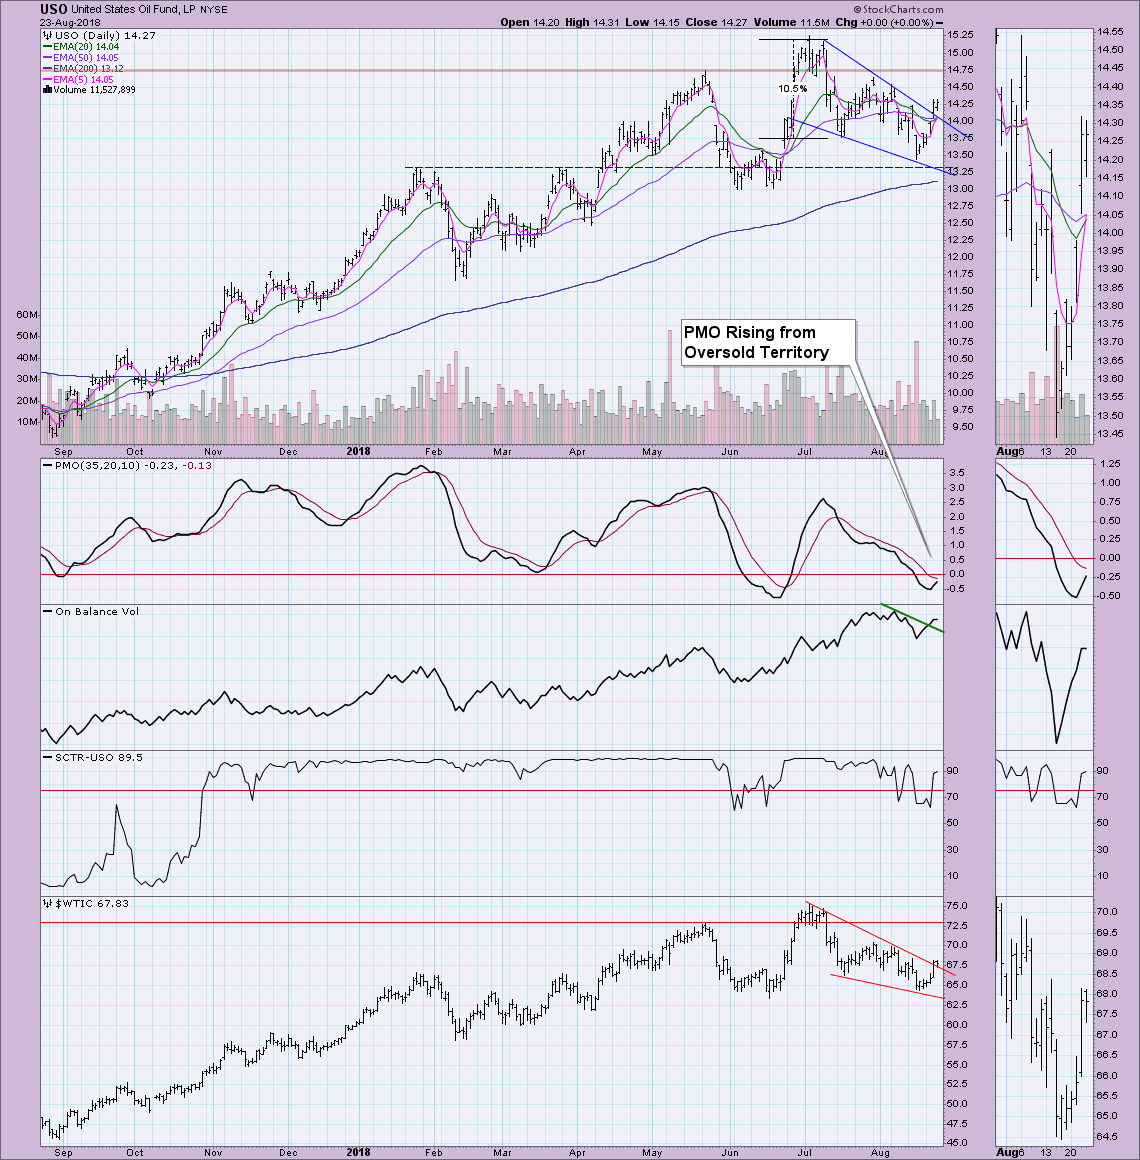
You'll note on the chart below of USO and $WTIC that both have descending/falling wedges that executed yesterday. Today's price action was stagnant, but the trading all took place above the wedge. If you use a measurement system of this chart pattern, you'll note that the height of the pattern goes from $13.75 to about $15.25. If we add the difference ($1.50) to the breakout point ($14.15), that would give us an upside target of $15.65, or a breakout above the July top. The PMO is rising with no hesitation toward a BUY signal. Volume on this recent rally is strong and we can see that the OBV has broken its downtrend. Short term, USO and $WTIC look bullish.
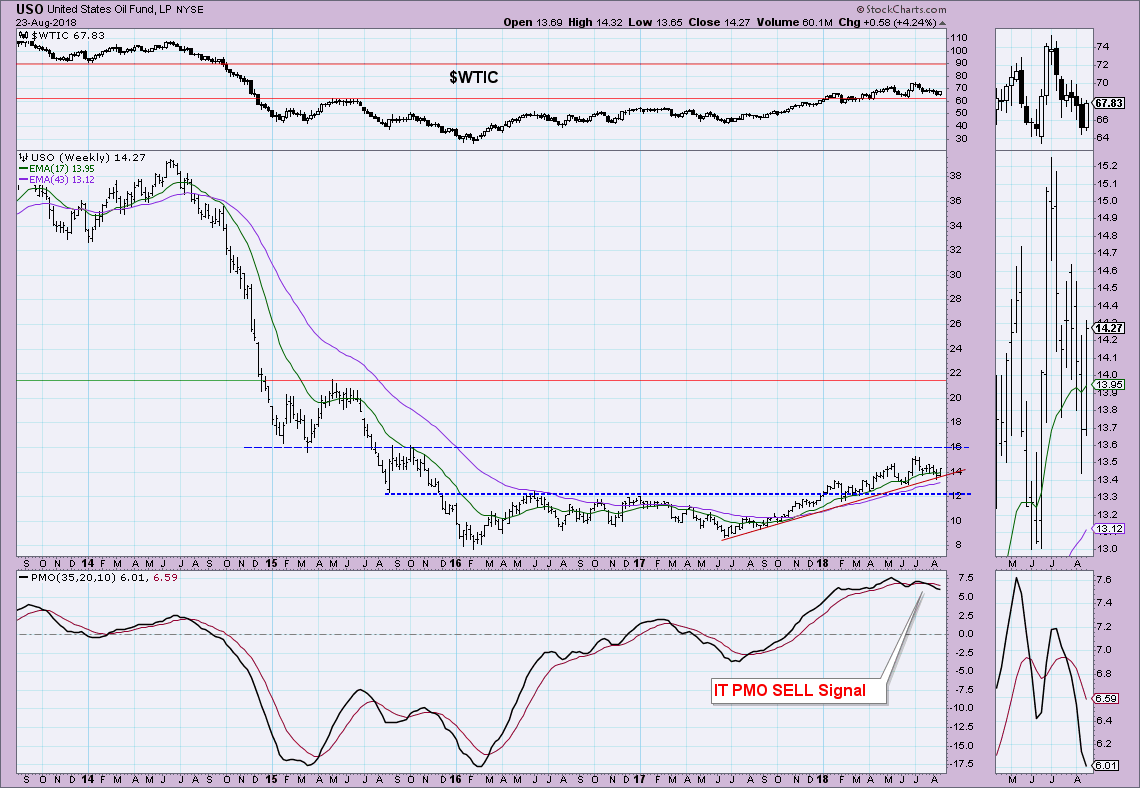
The weekly chart isn't as bullish mainly due to the declining PMO and its current SELL signal. However, we do see that the rising trend remains intact. Note that overhead resistance is at $16 which is very close to the $15.65 upside target on the daily chart.
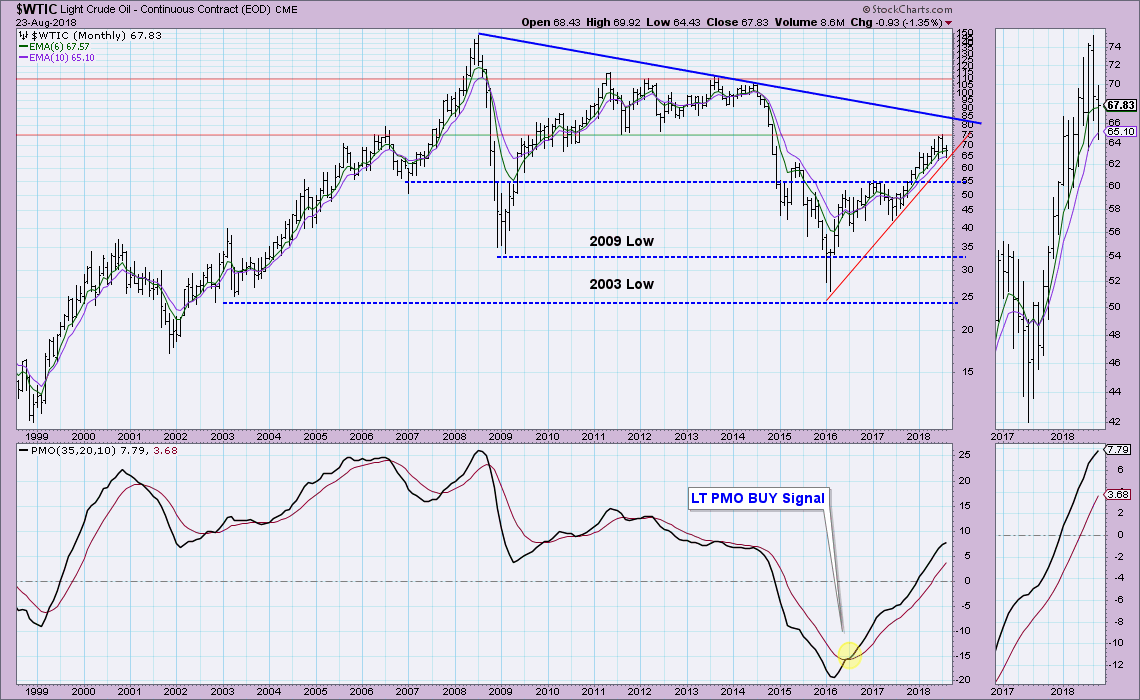
The monthly chart has a better looking PMO. It is rising and isn't overbought. The rising trend is still being held as well.
Conclusion: The shorter-term picture is bullish and both the weekly chart supports the possible upside target around $15.65. This is far from a sure thing, but using support around $14 or the 20/50-EMAs as exit points, the risk/reward here is pretty good.
Technical Analysis is a windsock, not a crystal ball.
Happy Charting!
- Erin
Helpful DecisionPoint Links:
DecisionPoint Shared ChartList and DecisionPoint Chart Gallery
Price Momentum Oscillator (PMO)
Swenlin Trading Oscillators (STO-B and STO-V)
**Don't miss DecisionPoint Commentary! Add your email below to be notified of new updates"**


