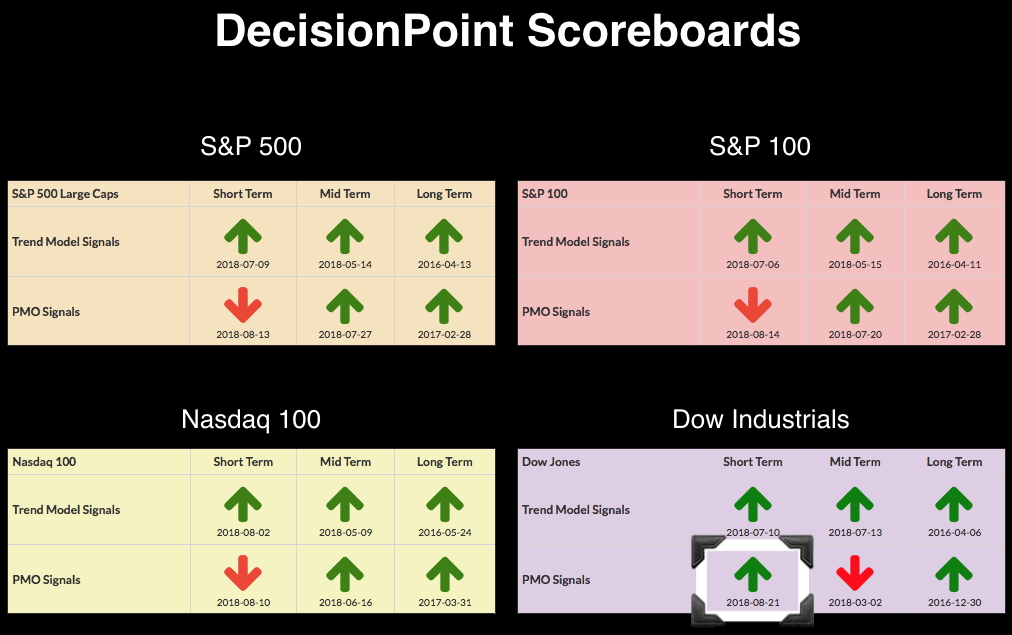
The NDX's PMO is still in decline. The SPX and OEX have rising PMOs, but no short-term PMO BUY signals. However, the Dow has recaptured its PMO BUY signal on the daily chart.

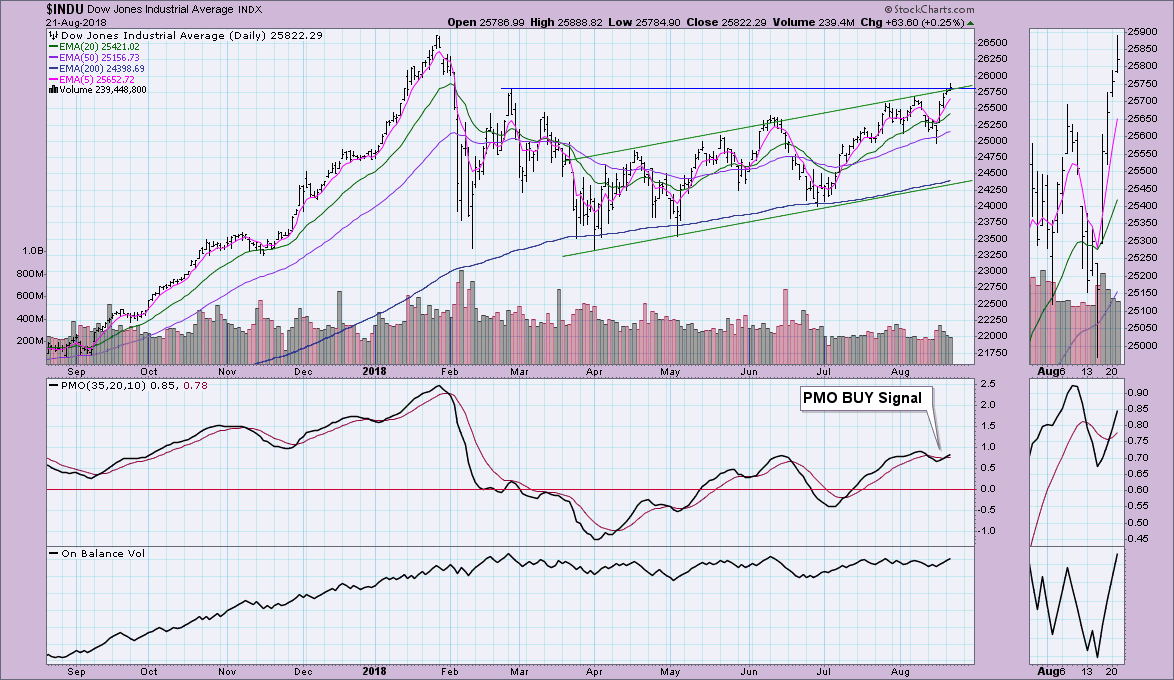
The Dow may seem to be recovering more quickly, but honestly it didn't deteriorate as much as the SPX and OEX PMOs. This gave the Dow's PMO a smaller distance to close to a new BUY signal. I note on the daily chart below that price did manage to push above the February top, but close just about on it for a mediocre breakout. I didn't care for the fact that price fell back on the close. Although the OBV is rising nicely, the volume pattern is showing less and less volume on this rally. A 'shooting star' candle and a decline in volume spells trouble ahead. We'll have to see if this PMO BUY signal can hold up.
Technical Analysis is a windsock, not a crystal ball.
Happy Charting!
- Erin
Helpful DecisionPoint Links:
DecisionPoint Shared ChartList and DecisionPoint Chart Gallery
Price Momentum Oscillator (PMO)
Swenlin Trading Oscillators (STO-B and STO-V)
**Don't miss DecisionPoint Commentary! Add your email below to be notified of new updates"**

