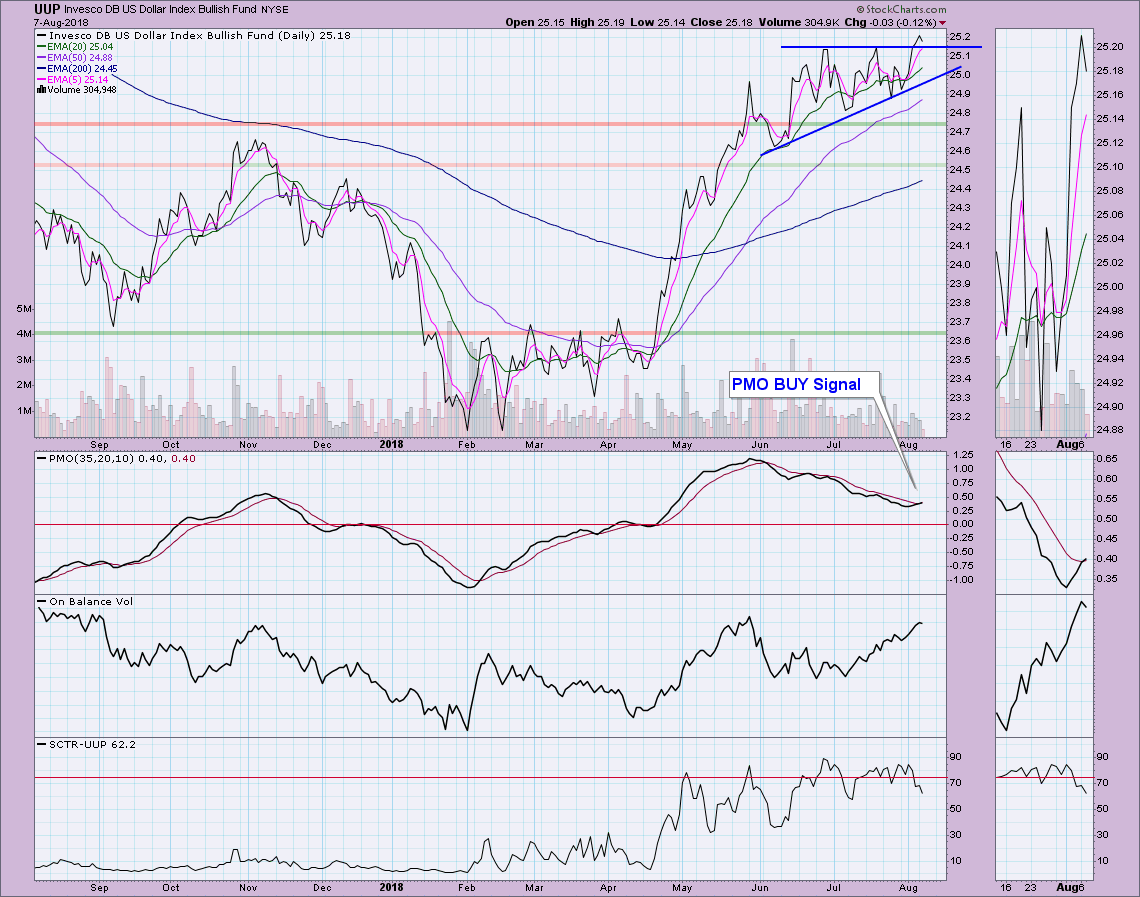
 Yesterday's breakout on UUP was impressive and although the Dollar pulled back slightly today, it didn't matter to the Price Momentum Oscillator (PMO) as it crossed its signal line and triggered a BUY signal.
While studying the OHLC chart for UUP, I realized if I looked at the closing prices only, there is a clear ascending triangle and yesterday it executed with the breakout above overhead resistance. Today's pullback didn't sacrifice that breakout. If we did a measurement, the minimum upside potential target is $25.70.
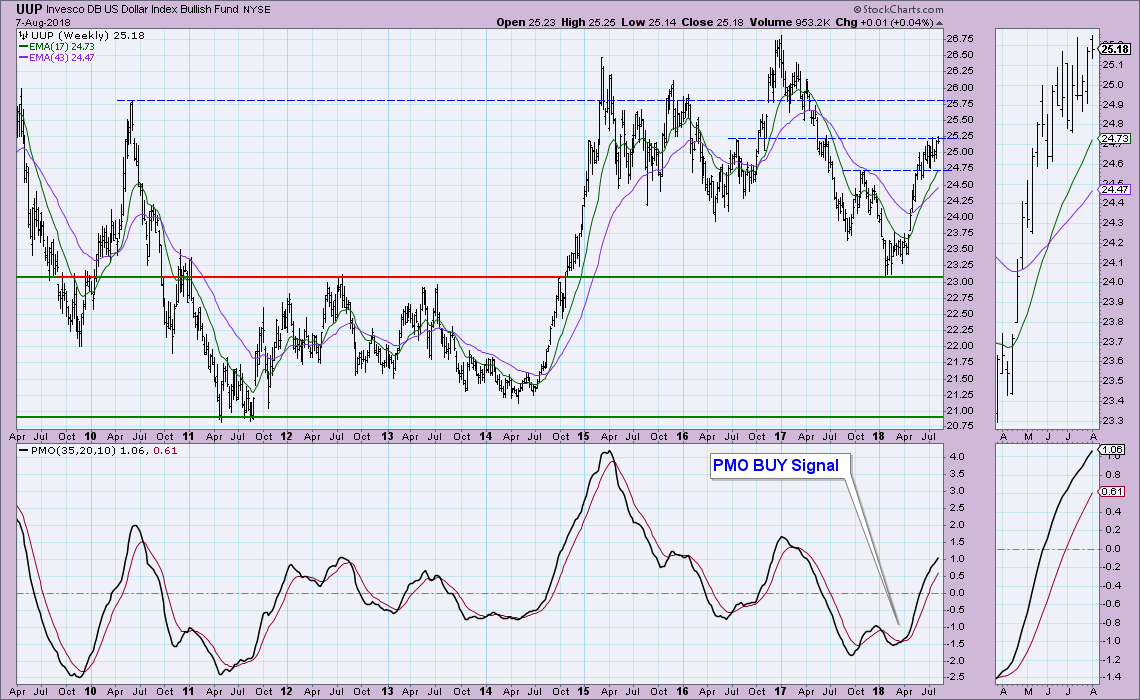
Interestingly, when you look at the weekly chart, you can see that $25.75 is one of the next areas of overhead resistance, so that calculation of $25.70 is very close. Notice that the weekly PMO is still rising. It has started to decelerate somewhat, but that makes sense given the trading range of the last 4 or 5 weeks.
Conclusion: I'm bullish on the Dollar. I would look for a move to challenge overhead resistance at the 2010 top just above $25.75.
Technical Analysis is a windsock, not a crystal ball.
Happy Charting!
- Erin
Helpful DecisionPoint Links:
DecisionPoint Shared ChartList and DecisionPoint Chart Gallery
Price Momentum Oscillator (PMO)
Swenlin Trading Oscillators (STO-B and STO-V)
**Don't miss DecisionPoint Commentary! Add your email below to be notified of new updates"**


