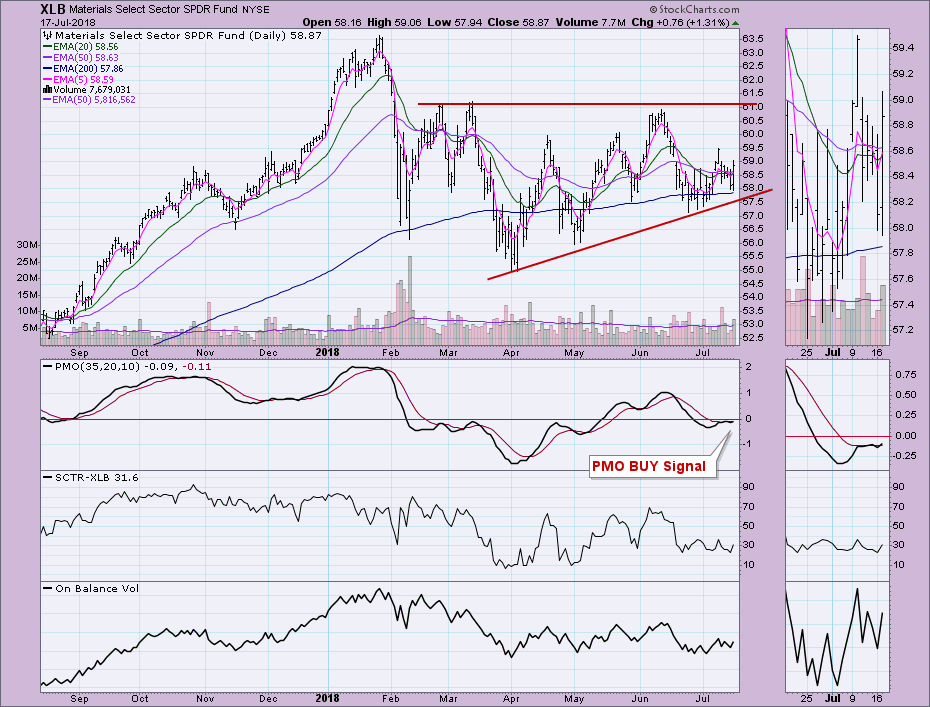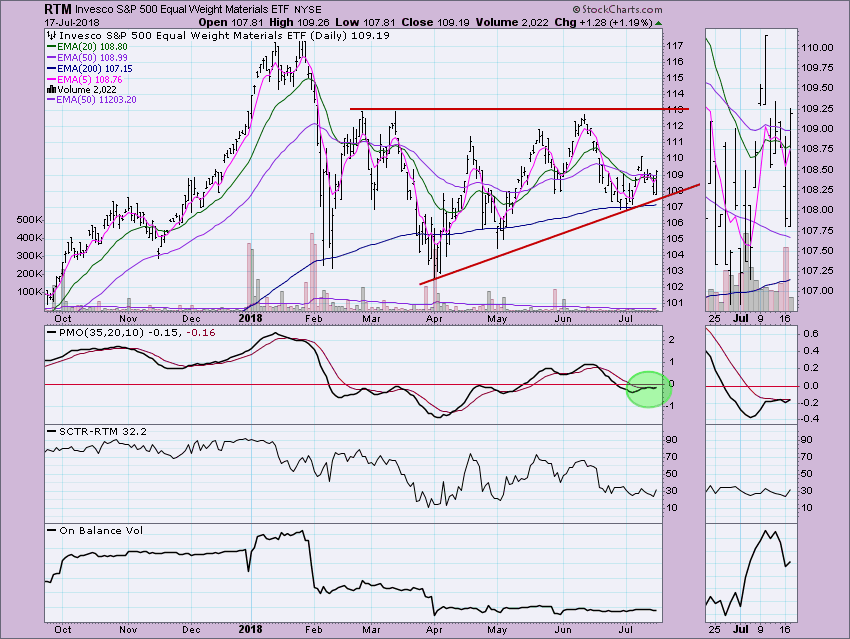
Today, both the Materials SPDR (XLB) and the equal-weight Materials ETF (RTM) posted new Price Momentum Oscillator (PMO) BUY signals. With talk of a trade war, many investors believe that the Materials sector could provide a decent hedge. I don't know if that is true, but I do know that the charts of these two Materials ETFs are looking promising.

Looking at the daily chart, you can see that the PMO BUY signal was triggered as it crossed above its signal line. I'm not too happy with the very thin margin between the PMO and its signal line as that could set up a whipsaw. I am encouraged by the close above both the 20/50-EMAs which could set up an IT Trend Model BUY signal should the 20-EMA cross above the 50-EMA. This has been a volatile sector to be sure, but the volatility has created a bullish ascending triangle. While not "textbook" in my opinion due to the white space between horizontal resistance and April, May and July tops, I do still believe the pattern is viable.
You can see a similar set-up on the equal-weight version, RTM.
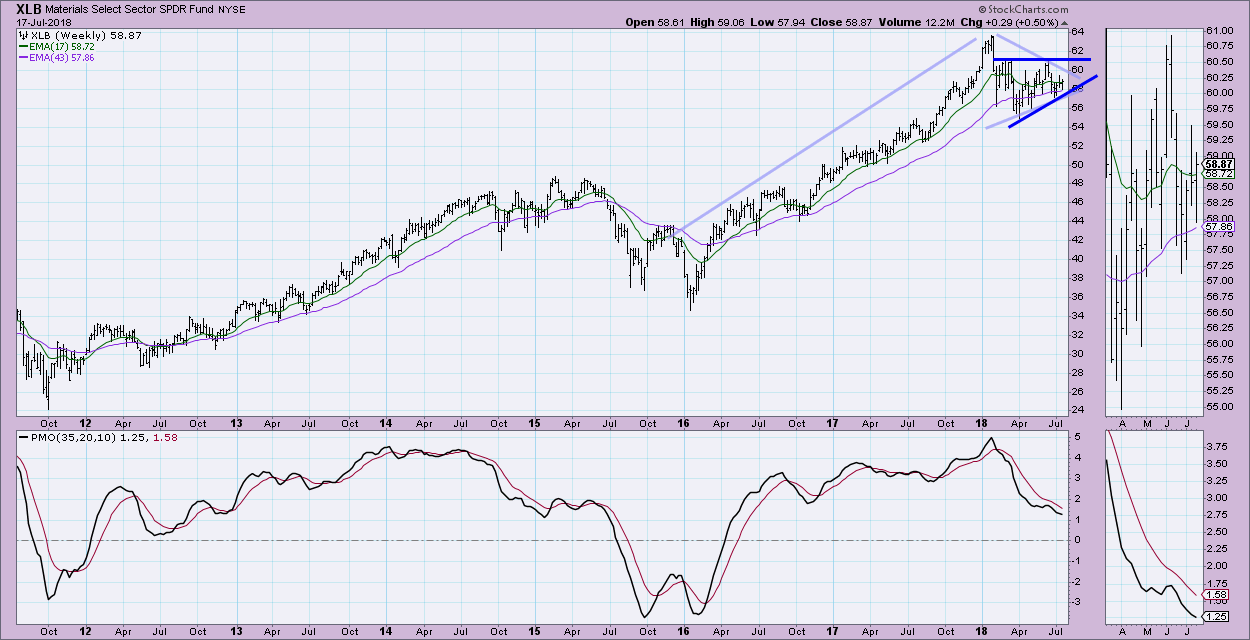
I took a look at the weekly chart below and was pleasantly surprised to see a long-term bullish flag formation. The intermediate-term PMO is still in decline, but it does appear to be decelerating somewhat. The ascending wedge is very visible on the weekly chart so I do believe it is a formation to watch.
Conclusion: The Materials sector could be turning around and be ready to make a run. I would apply caution if you get in now since we don't have a rising weekly PMO, nor a breakout above overhead resistance. It could be a short-term play, but I think the weekly chart shows that this might be a better intermediate-term trade.
Technical Analysis is a windsock, not a crystal ball.
Happy Charting!
- Erin
Helpful DecisionPoint Links:
DecisionPoint Shared ChartList and DecisionPoint Chart Gallery
Price Momentum Oscillator (PMO)
Swenlin Trading Oscillators (STO-B and STO-V)
**Don't miss DecisionPoint Commentary! Add your email below to be notified of new updates"**


