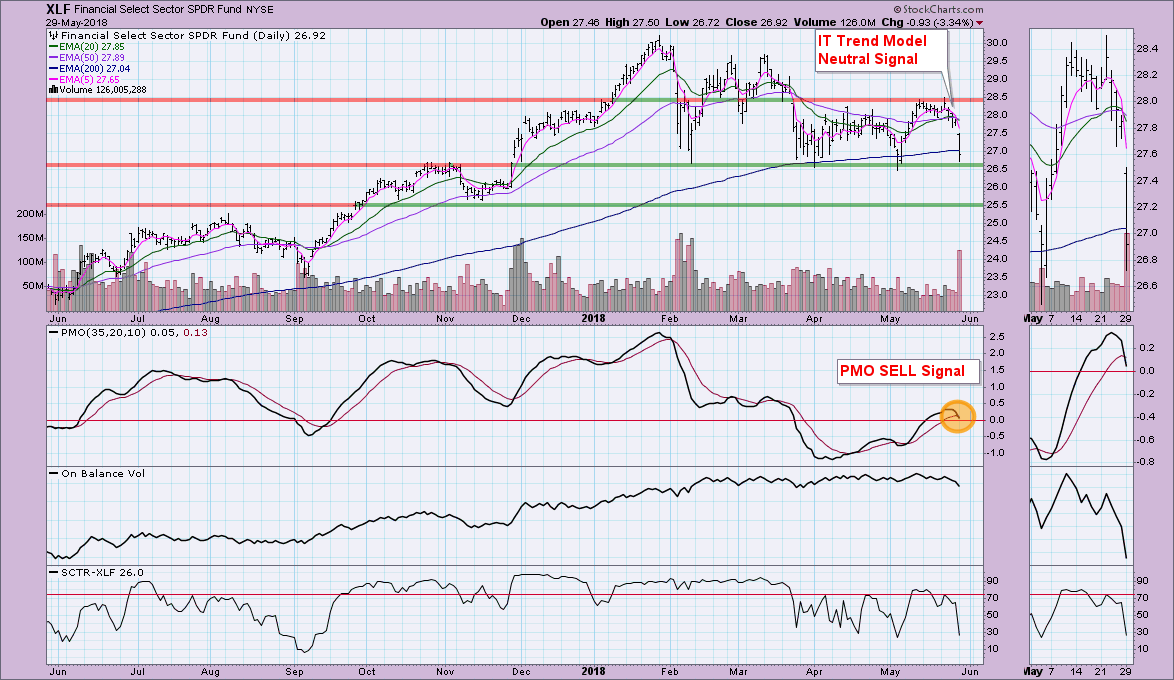
The markets spent much of last week consolidating or pulling back. The Financial sector was no exception. As with many of the major markets, XLF was hit especially hard today with a decline of over 3.3%. This was a more than decisive breakdown which would suggest lower prices ahead.
If you take nothing else from this article, I hope that you look at the importance of support for XLF at $26.50. If it should fail, which the nasty PMO SELL signal suggests, the next interim area of support is around $25.50 which corresponds to the August 2017 high and the lows in November 2017.
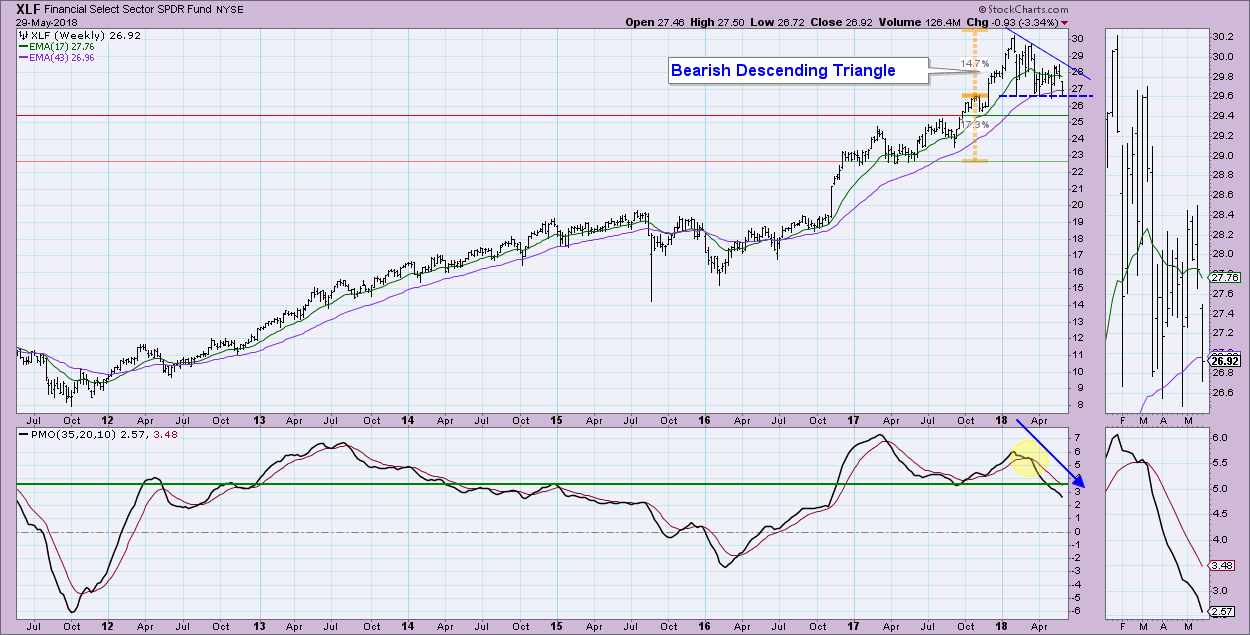
 The weekly picture is not optimistic either. The descending triangle formation is dominating the right side of this chart. It suggests we will see a breakdown below support with a decline that could take price as low as $23 or more.
 Conclusion: Indicators suggest we will see further decline in the Financial sector. If treasury yields turn back up, this sector should find favor again, but if yields continue lower a breakdown should be expected. I was feeling better about the market in general last week, but seeing an aggressive sector on the brink of a major decline is giving me pause. I'll be writing about our indicator sets tomorrow. They are showing deterioration.
Technical Analysis is a windsock, not a crystal ball.
Happy Charting!
- Erin
Helpful DecisionPoint Links:
DecisionPoint Shared ChartList and DecisionPoint Chart Gallery
Price Momentum Oscillator (PMO)
Swenlin Trading Oscillators (STO-B and STO-V)
**Don't miss DecisionPoint Commentary! Add your email below to be notified of new updates"**
