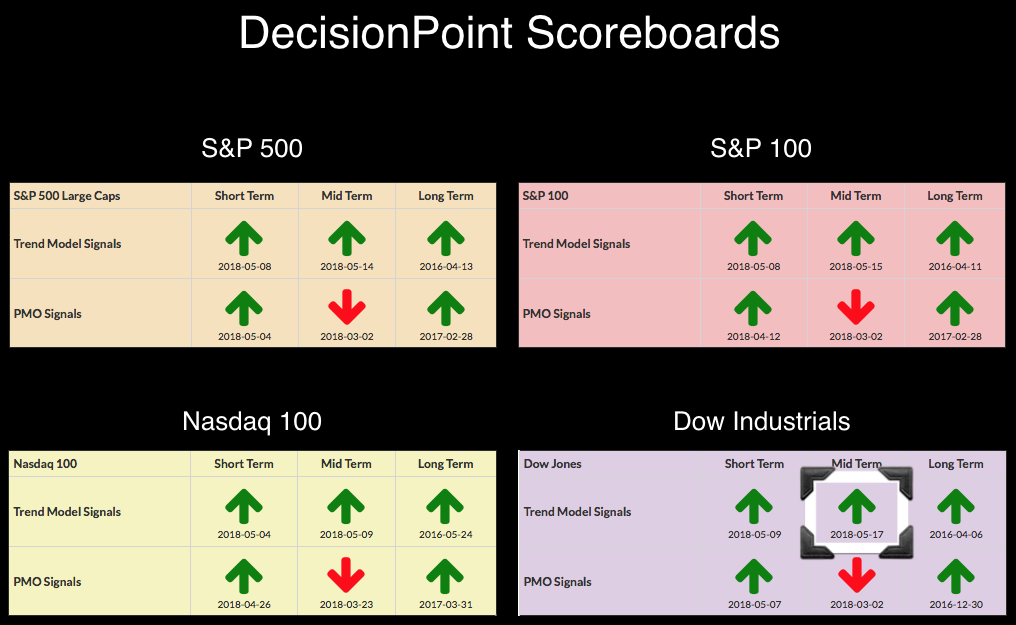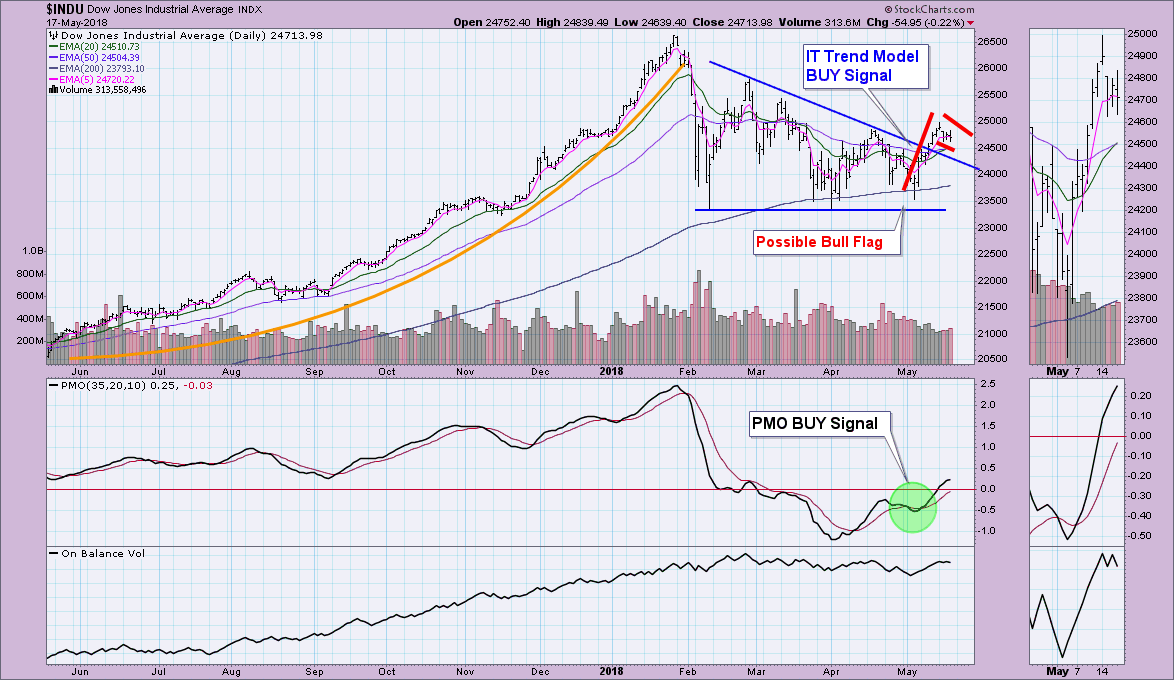
The Dow was the laggard but it finally managed an Intermediate-Term Trend Model BUY signal today when the 20-EMA crossed above the 50-EMA. This moves all four Scoreboards' Trend Models to BUY signals in the short-, intermediate- and long-terms. The last time all three timeframes were all on Trend Model BUY signals was March 13th. This could actually be considered worrisome since it was shortly after March 13th that the rally failed and the correction resumed. I'm not looking for that. If you read the "DP Alert" I wrote yesterday, you'll see what is stirring my optimism.

In the case of this new signal versus the signal that arrived mid-March when the 20-EMA crossed above the 50-EMA, I see a promising flag. This flag if executed would bring price right back to overhead resistance at the all-time highs. I believe this flag will execute. Looking in the thumbnail you can make out a small island that formed over the past three days. I would look at this as a possible island reversal formation. Meaning, the gap should close and prices should resume the rally.
Technical Analysis is a windsock, not a crystal ball.
Happy Charting!
- Erin
Helpful DecisionPoint Links:
DecisionPoint Shared ChartList and DecisionPoint Chart Gallery
Price Momentum Oscillator (PMO)
Swenlin Trading Oscillators (STO-B and STO-V)
**Don't miss DecisionPoint Commentary! Add your email below to be notified of new updates"**

