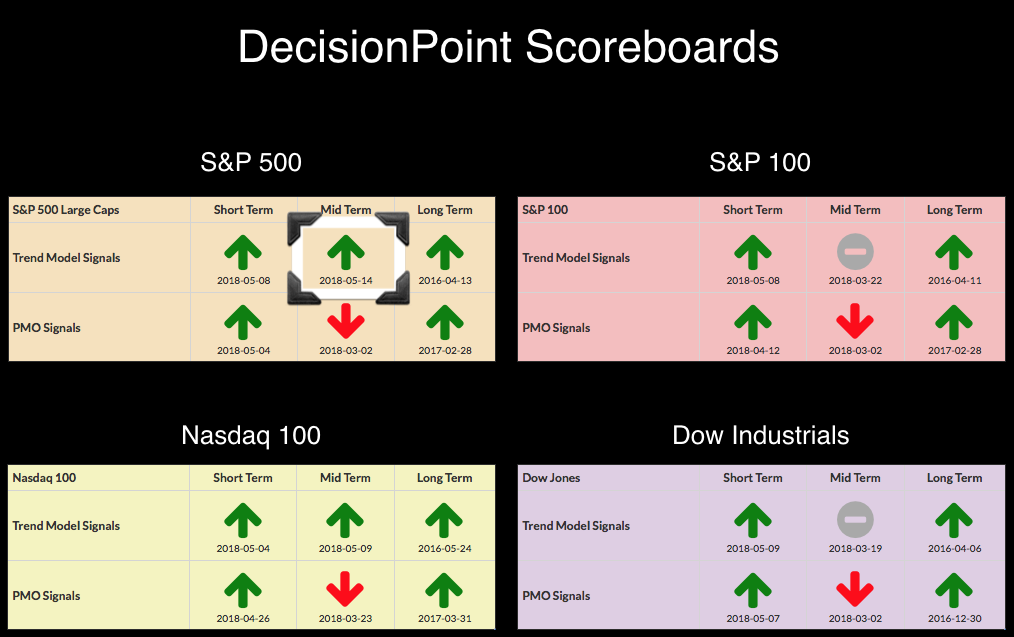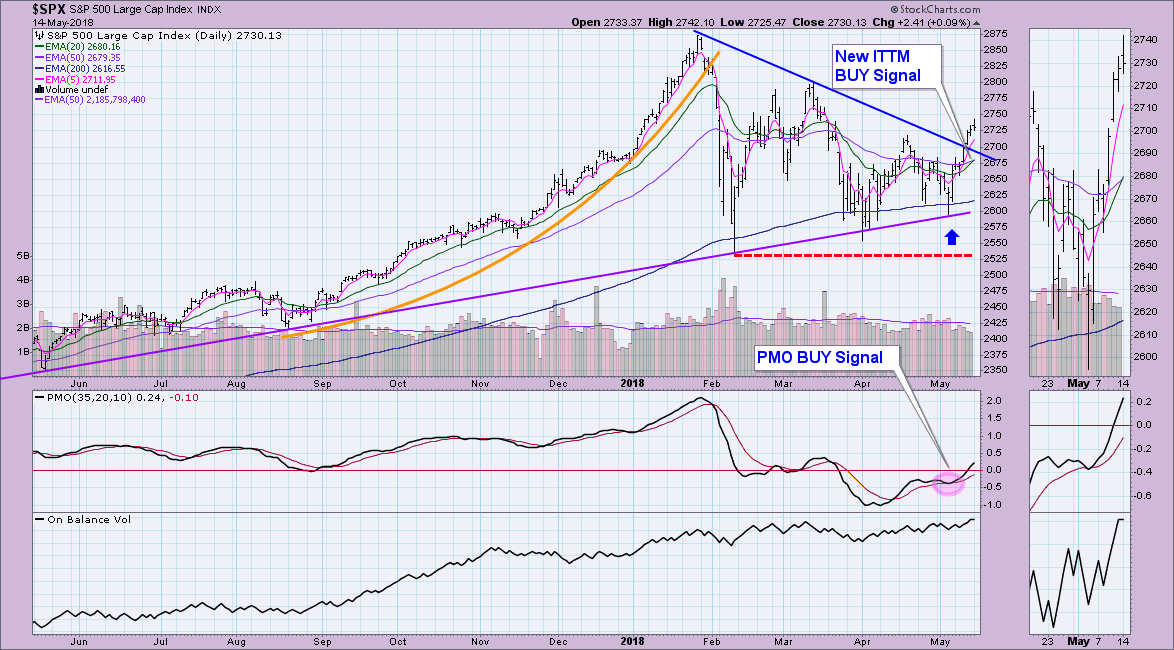
The SPX is the 2nd of the four DP Scoreboard indexes to trigger a new IT Trend Model BUY signal. This signal replaces a late March Neutral signal.

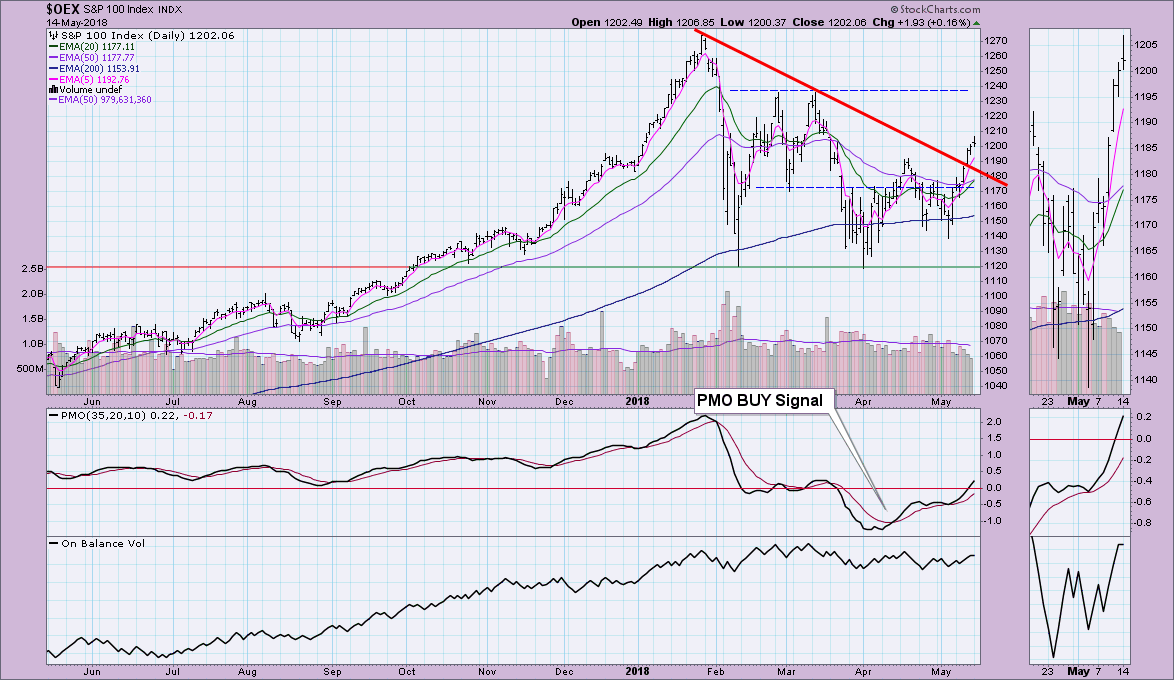
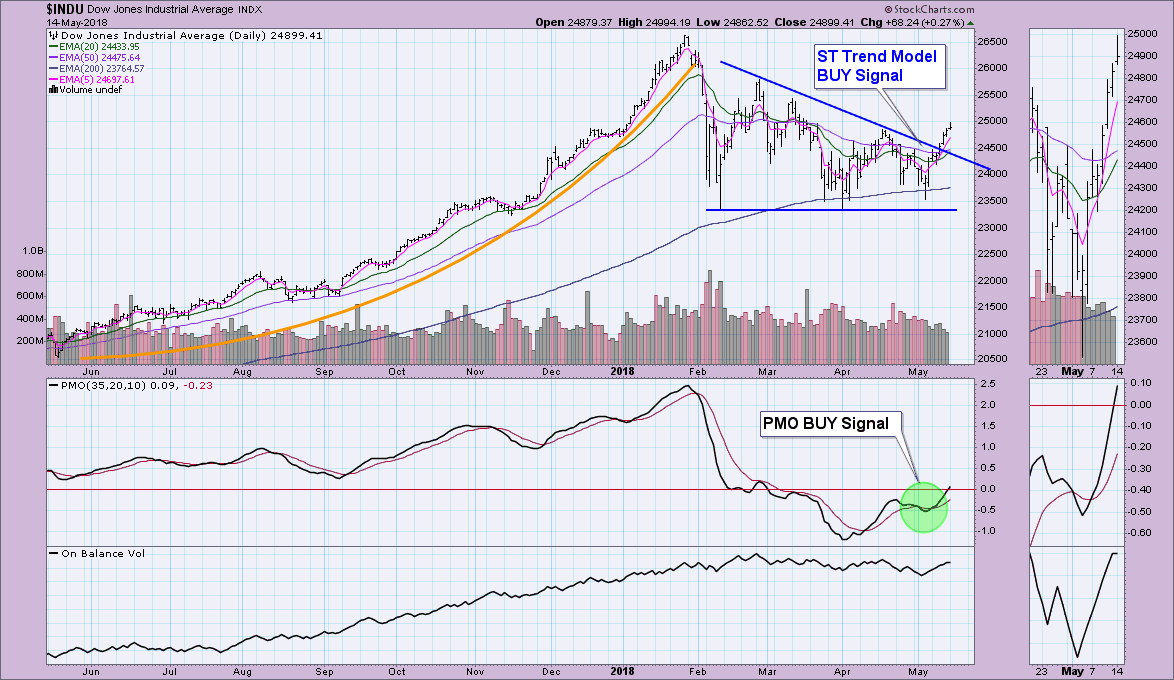
I've added the OEX and Dow charts below the SPX so you can see how close they are to triggering IT Trend Model BUY signals as well. An IT Trend Model BUY signal is triggered when the 20-EMA crosses above the 50-EMA. We haven't seen the 20-EMA above the 50-EMA since mid-March so I find this signal very encouraging. This signal follows a NDX ITTM BUY signal last week. These breakouts from declining tops trendlines as well as support holding along long-term rising bottoms trendlines or simply horizontal resistance at the Feb/Mar lows.
Technical Analysis is a windsock, not a crystal ball.
Happy Charting!
- Erin
Helpful DecisionPoint Links:
DecisionPoint Shared ChartList and DecisionPoint Chart Gallery
Price Momentum Oscillator (PMO)
Swenlin Trading Oscillators (STO-B and STO-V)
**Don't miss DecisionPoint Commentary! Add your email below to be notified of new updates"**


