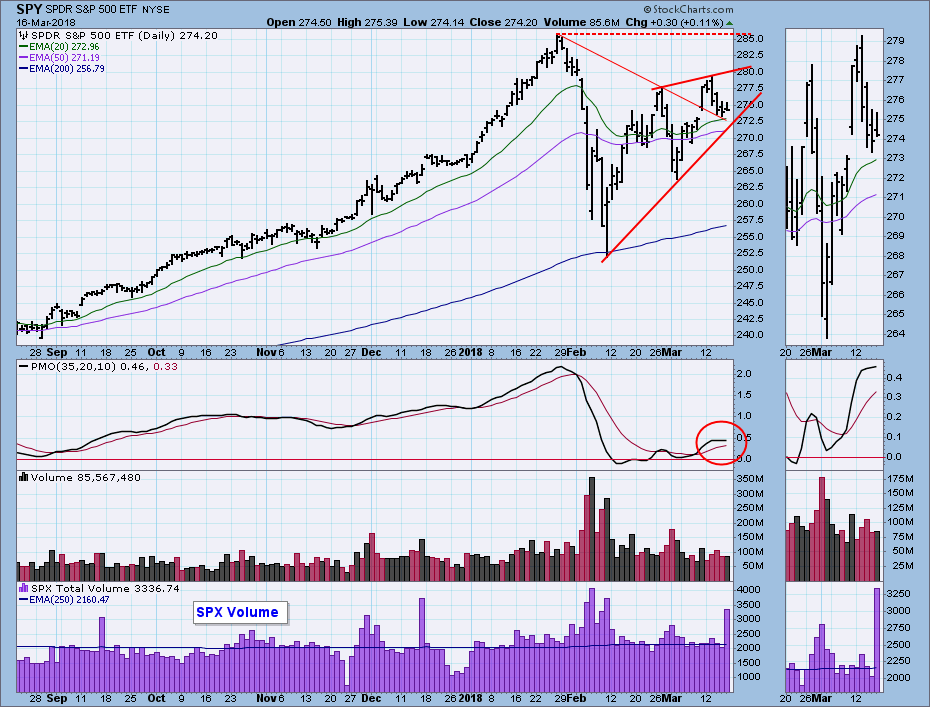
First, the super high S&P 500 volume today was because of options expiration, so don't read anything else into it.
Last Friday's encouraging breakout is looking like a short-term bull trap , as the market pulled back to the declining tops line support this week. Drawing a line across the two recent tops forms the top of a bearish rising wedge formation, bearish because rising wedges normally resolve downward. The reason for this tendency is that the rising trend line at the bottom of the wedge is usually too steep to be sustained, and a breakdown (correction) is needed, at the very least, to set a less accelerated trend angle.
The DecisionPoint Weekly Wrap presents an end-of-week assessment of the trend and condition of the stock market (S&P 500), the U.S. Dollar, Gold, Crude Oil, and Bonds.
SECTORS
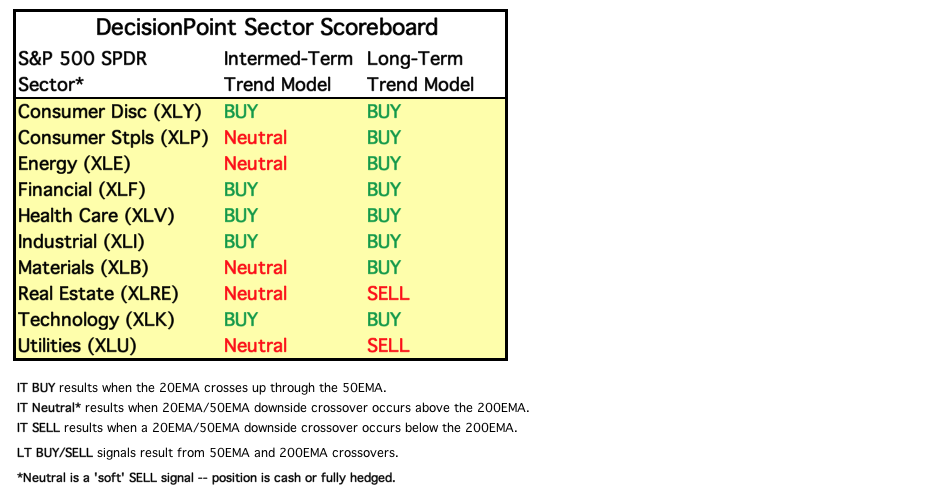
Each S&P 500 Index component stock is assigned to one, and only one, of 10 major sectors. This is a snapshot of the Intermediate-Term and Long-Term Trend Model signal status for those sectors. There were no signal changes this week.
STOCKS
IT Trend Model: BUY as of 11/15/2016
LT Trend Model: BUY as of 4/1/2016
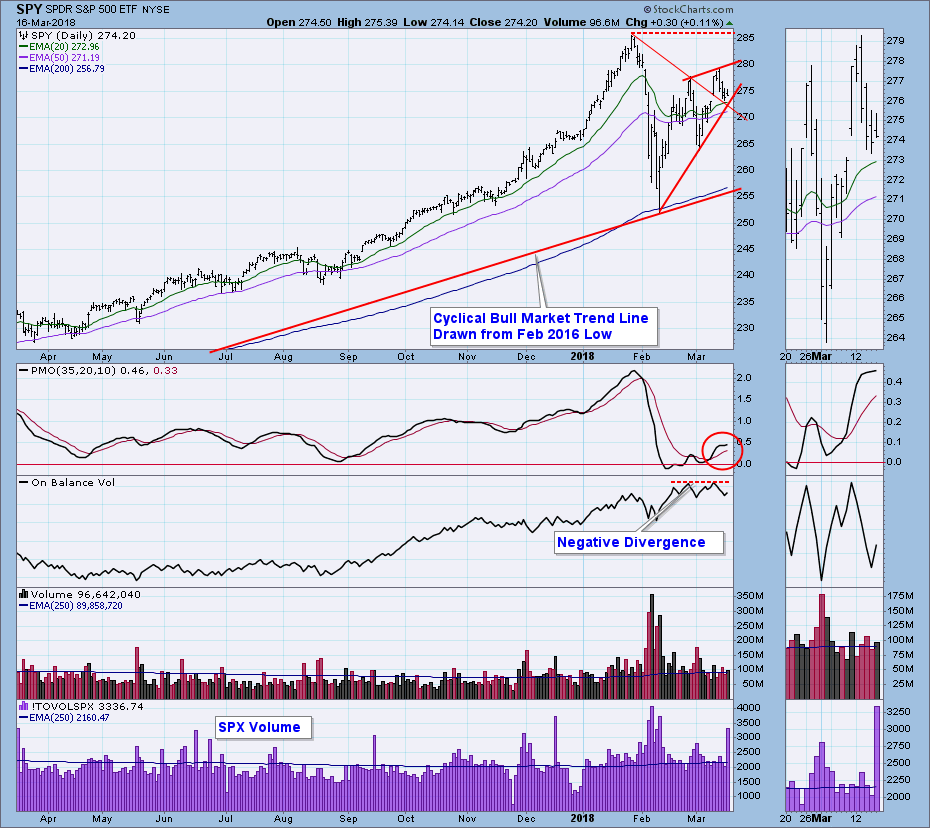
Daily Chart: The only thing to add to my opening comments is that there is an OBV negative divergence.
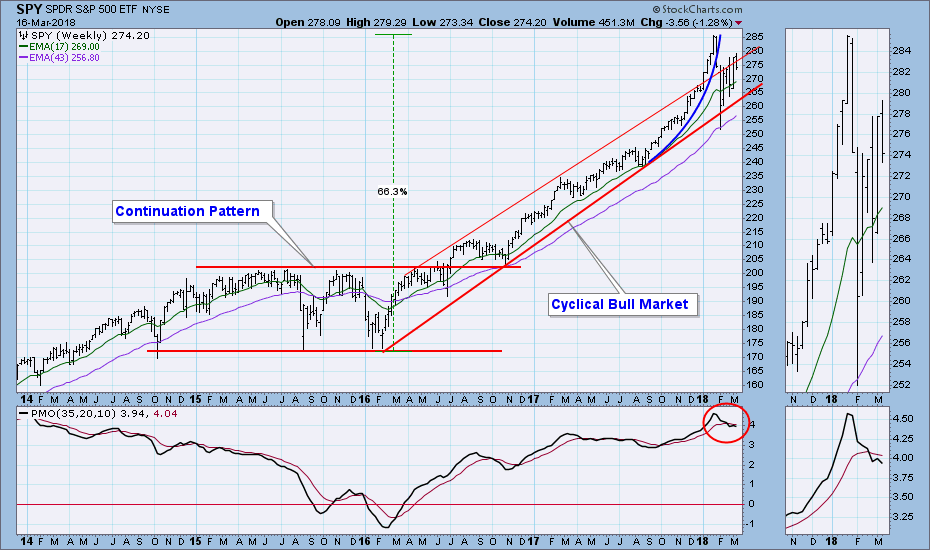
Weekly Chart: The weekly PMO turned down below the signal line, but the last two changes of direction were abrupt rather than smooth, so the message is not so clear.
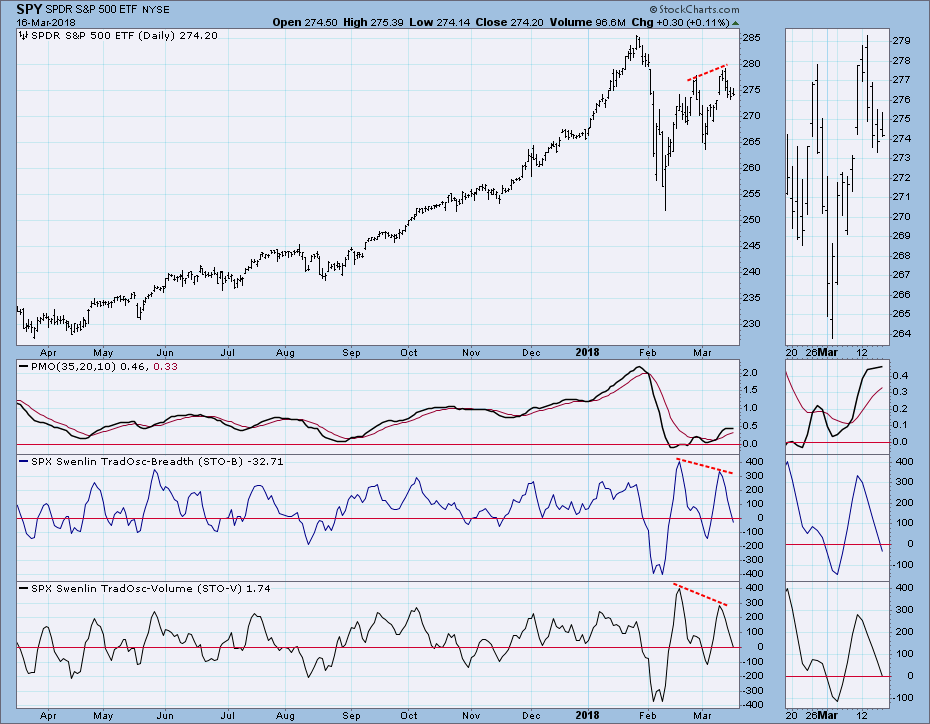
 Short-Term Market Indicators: Both breadth and volume indicators have formed negative divergences.
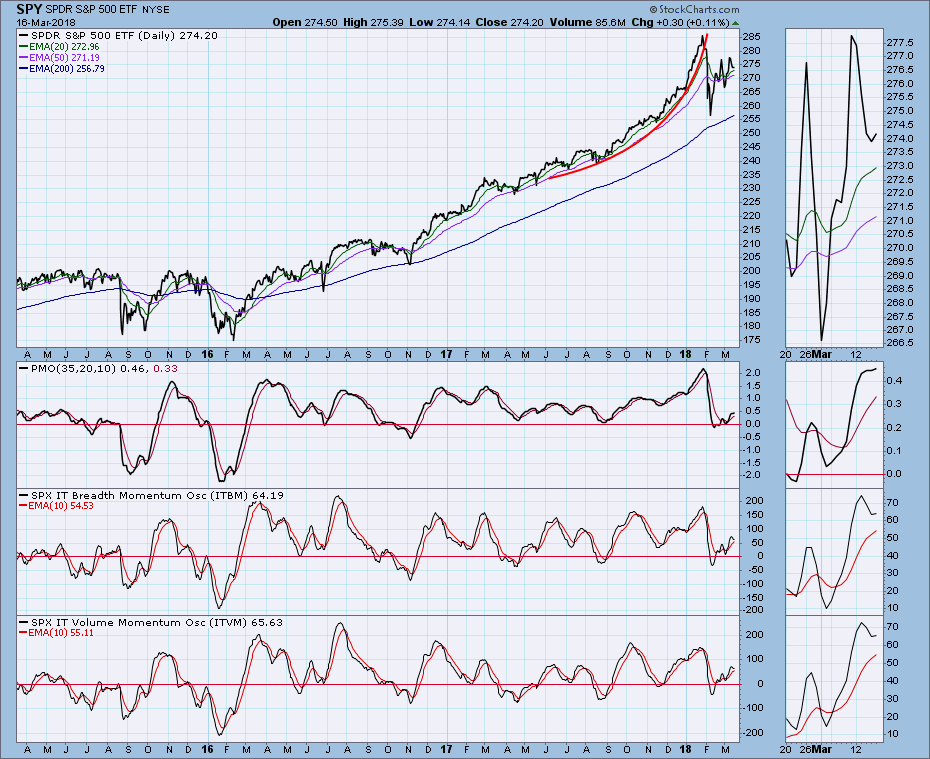
Intermediate-Term Market Indicators: All indicators are rising in the neutral zone, and they allow for big moves in either direction.
Conclusion: Last week I wrote ". . . even though the parabolic was corrected, the current rate of ascent is not sustainable. One possible, and desirable, scenario would be for the market to churn sideways in a 5% to 10% range for several months in order to digest some of the excesses," and I'm liking that idea more and more. When a parabolic advance finally breaks, my first expectation is that price will head south in a hurry; however, a less common outcome is what the late Kennedy Gammage used to call a high-level consolidation, which could look a lot like what I just described above, or perhaps like SPY's 18-month consolidation between 2014 and 2016. To clarify, that is less of a forecast than it is wishful thinking, but because there was no follow through on last week's breakout, I'm beginning to think of it as a possibility.
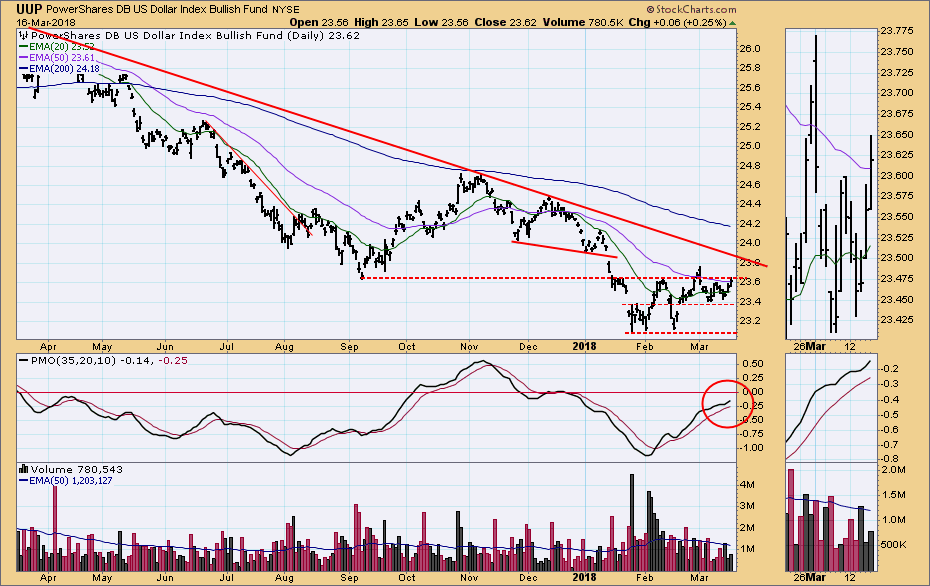
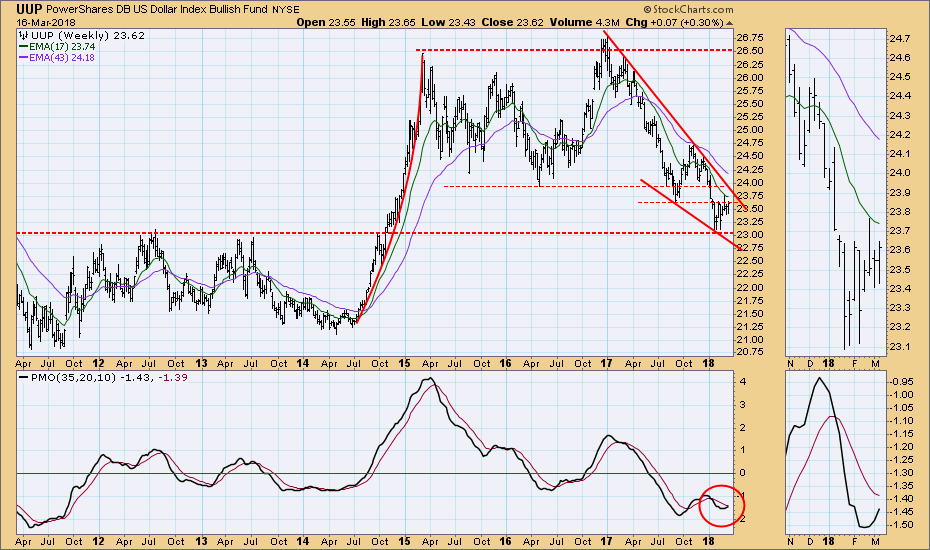
DOLLAR (UUP)
IT Trend Model: SELL as of 12/21/2017
LT Trend Model: SELL as of 5/24/2017
Daily Chart: There is some pretty strong resistance at 23.65, and a long-term declining tops line will be an obstacle if the horizontal support is overcome.
Weekly Chart: A massive falling wedge and a weekly PMO bottom imply that UUP will be showing some strength in the long term, but UUP is in a bear market, and the likelihood of an upside resolution of the falling wedge is lower than it would be in a bull market.
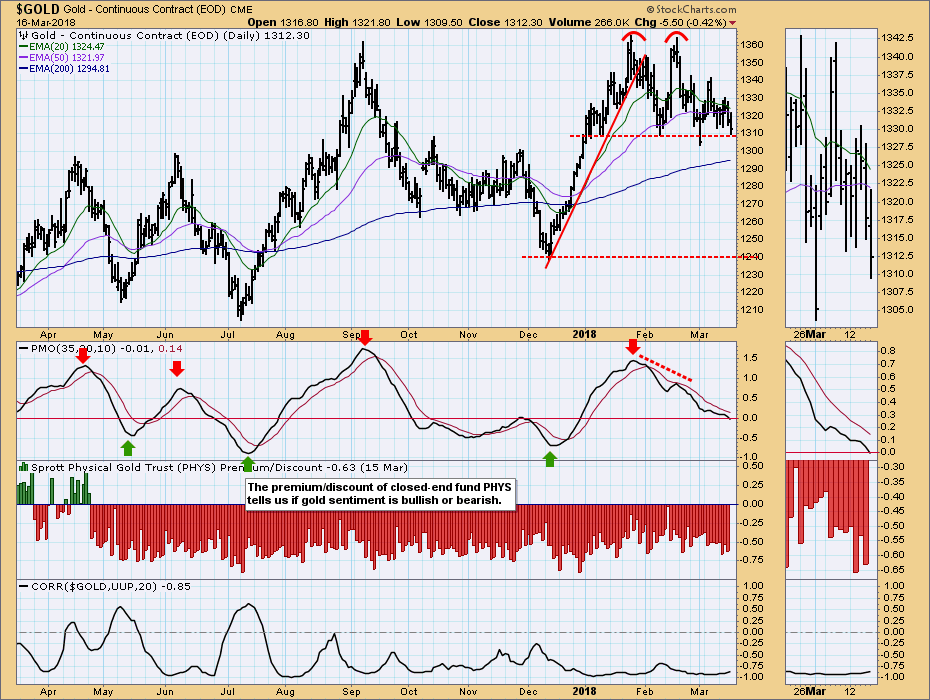
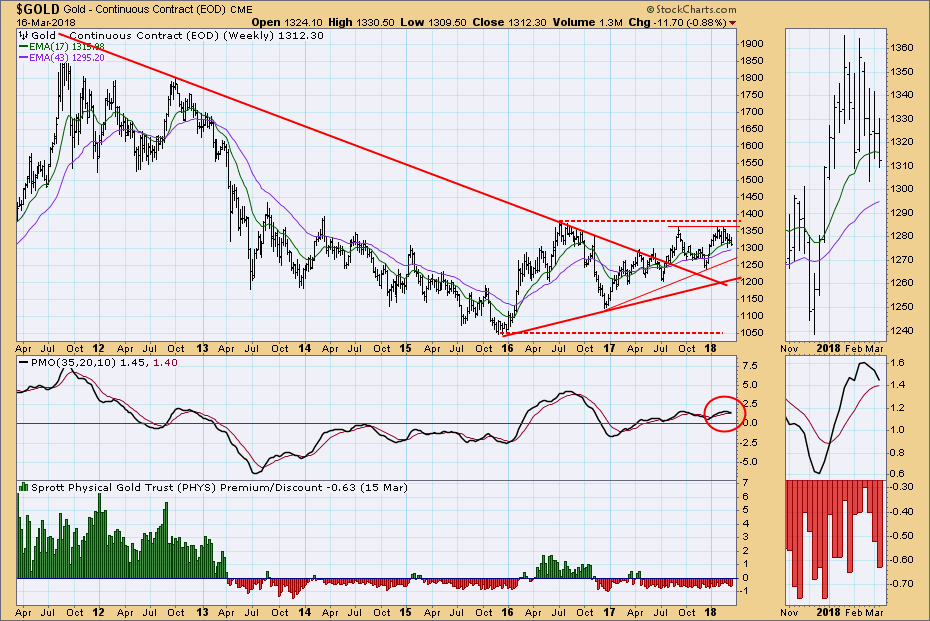
GOLD
IT Trend Model: BUY as of 1/2/2018
LT Trend Model: BUY as of 4/12/2017
Daily Chart: Gold has been moving sideways for two-and-a-half months, so the 20EMA and 50EMA are moving closer together. For the last three months there has been a fairly high negative correlation with the dollar (UUP), so strength in the dollar could result in gold breaking down.
Weekly Chart: Gold is still positive in this time frame. The weekly PMO has topped, but this is in the context of sideways PMO movement for about a year (well above the zero line).
CRUDE OIL (USO)
IT Trend Model: BUY as of 9/6/2017
LT Trend Model: BUY as of 11/2/2017
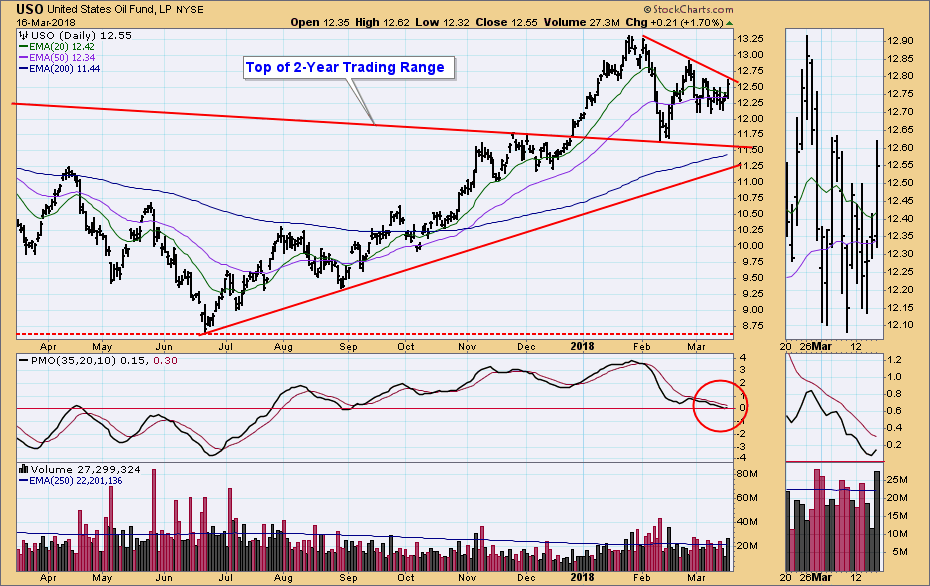
Daily Chart: After the late-February top, we might have expected USO to descend to the bottom of the falling wedge formation, but it only made it half-way down, consolidating before heading back up to the top of the wedge on Friday. Falling wedges normally resolve upward, so USO seems to be sticking to that script.
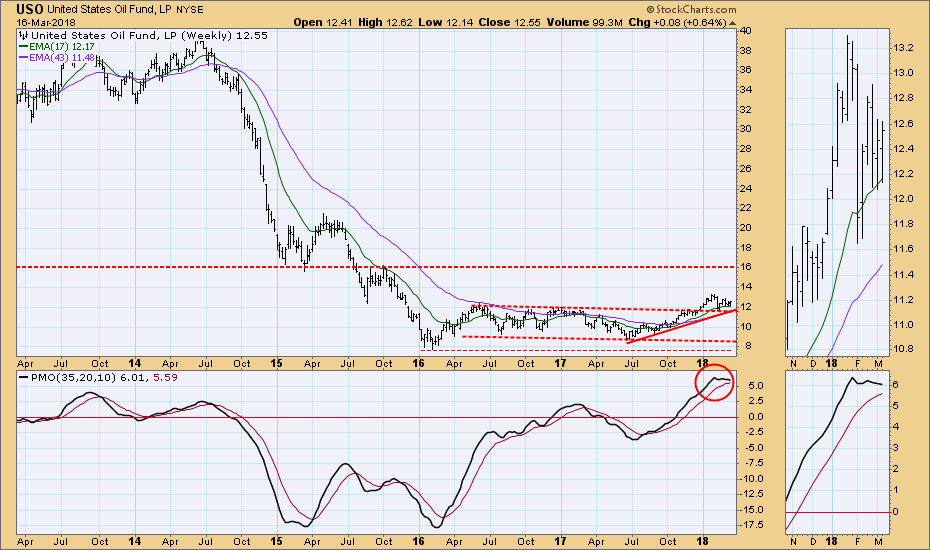
Weekly Chart: In this time frame there seems to be potential for USO to rally to 16.00 (about $78 for $WTIC), but a cause for concern is the fact that the weekly PMO is overbought and topping.
BONDS (TLT)
IT Trend Model: NEUTRAL as of 1/11/2018
LT Trend Model: SELL as of 2/8/2018
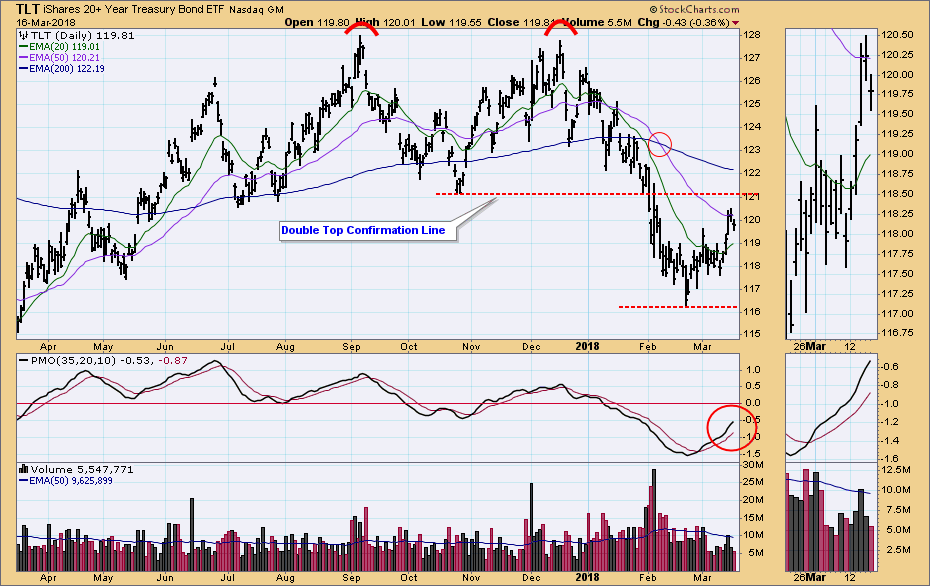
Daily Chart: Last month TLT broke down through the support of a line drawn across the low between two tops. After bottoming in late-February, it has been rallying back toward the point of breakdown, a technical expectation that is not particularly bullish.
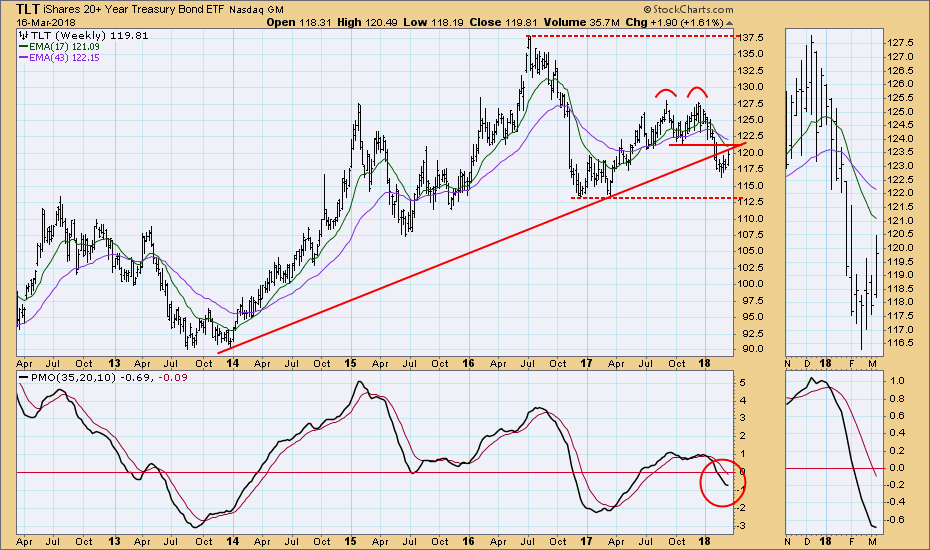
Weekly Chart: Additional overhead resistance from a long-term rising trend line is revealed in this time frame.
**Don't miss any of the DecisionPoint commentaries! Go to the "Notify Me" box toward the end of this blog page to be notified as soon as they are published.**
Technical Analysis is a windsock, not a crystal ball.
Happy Charting!
- Carl
NOTE: The signal status reported herein is based upon mechanical trading model signals, specifically, the DecisionPoint Trend Model. They define the implied bias of the price index based upon moving average relationships, but they do not necessarily call for a specific action. They are information flags that should prompt chart review. Further, they do not call for continuous buying or selling during the life of the signal. For example, a BUY signal will probably (but not necessarily) return the best results if action is taken soon after the signal is generated. Additional opportunities for buying may be found as price zigzags higher, but the trader must look for optimum entry points. Conversely, exit points to preserve gains (or minimize losses) may be evident before the model mechanically closes the signal.
Helpful DecisionPoint Links:
DecisionPoint Shared ChartList and DecisionPoint Chart Gallery
Price Momentum Oscillator (PMO)
Swenlin Trading Oscillators (STO-B and STO-V)

