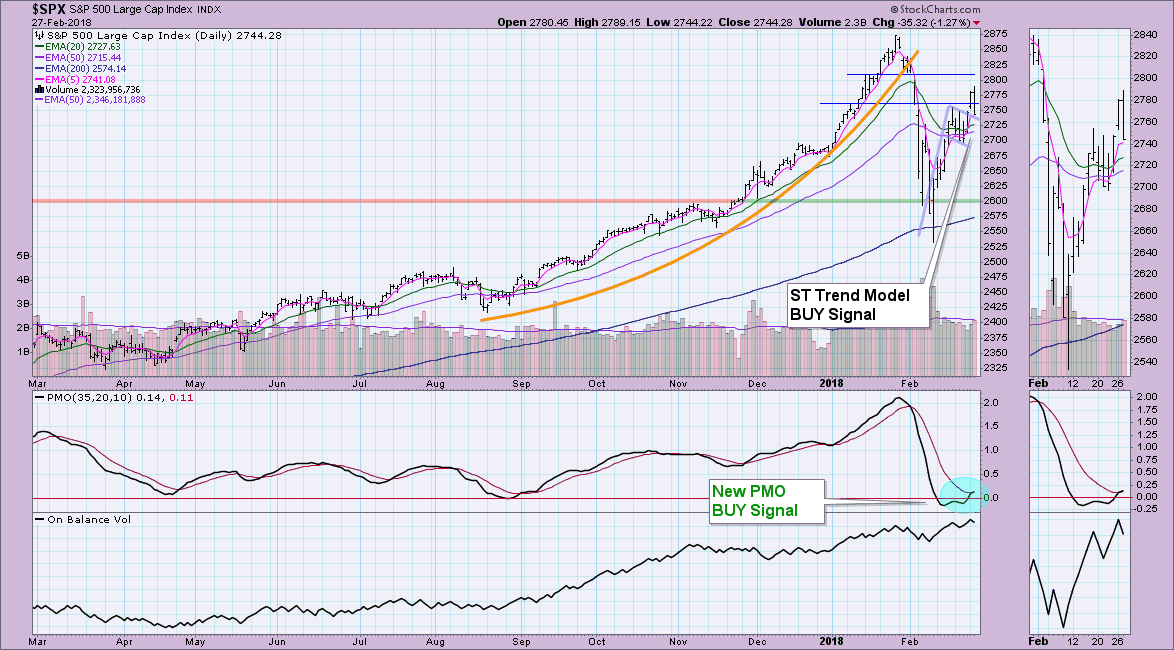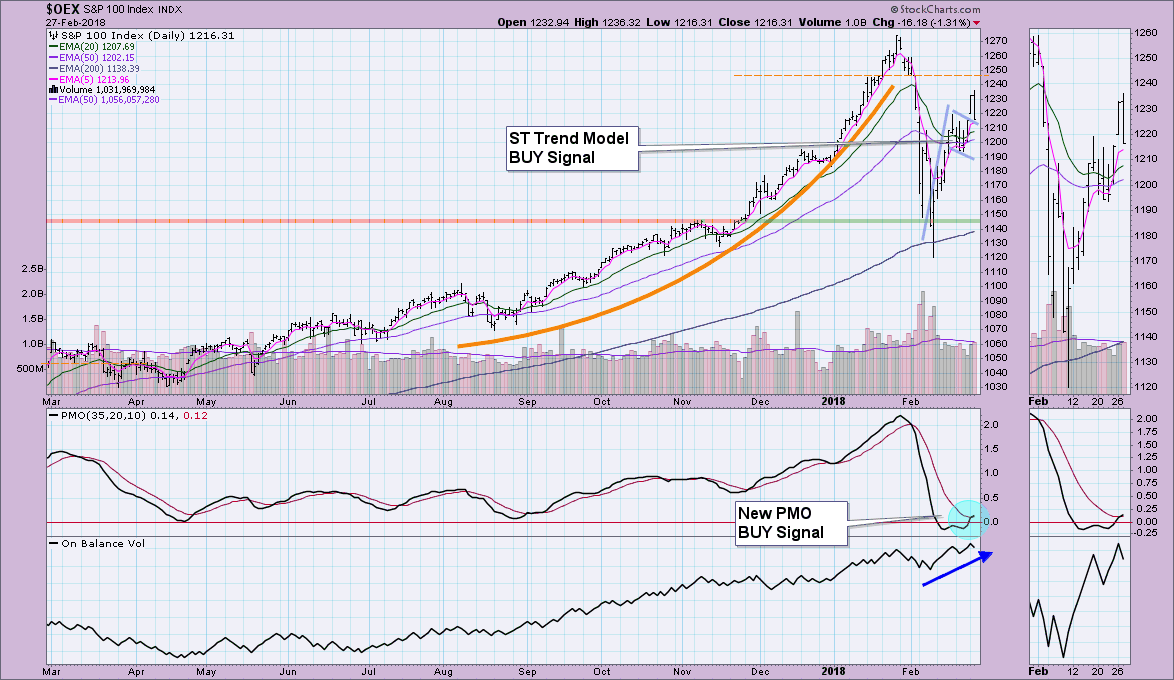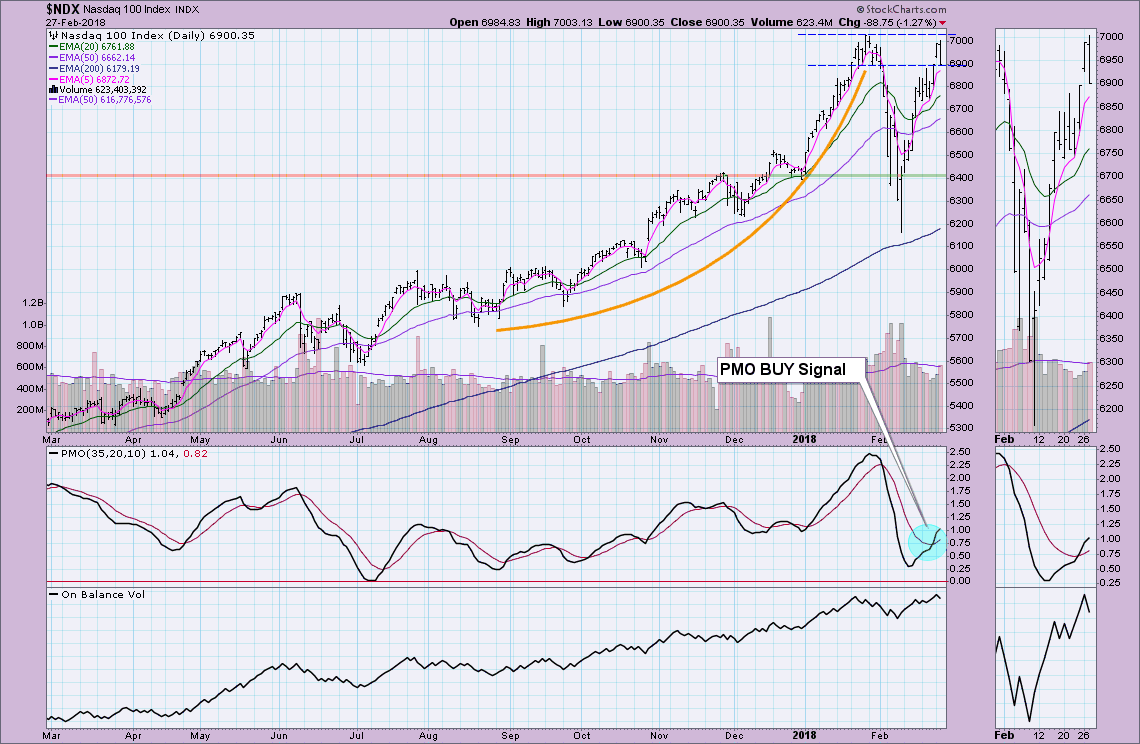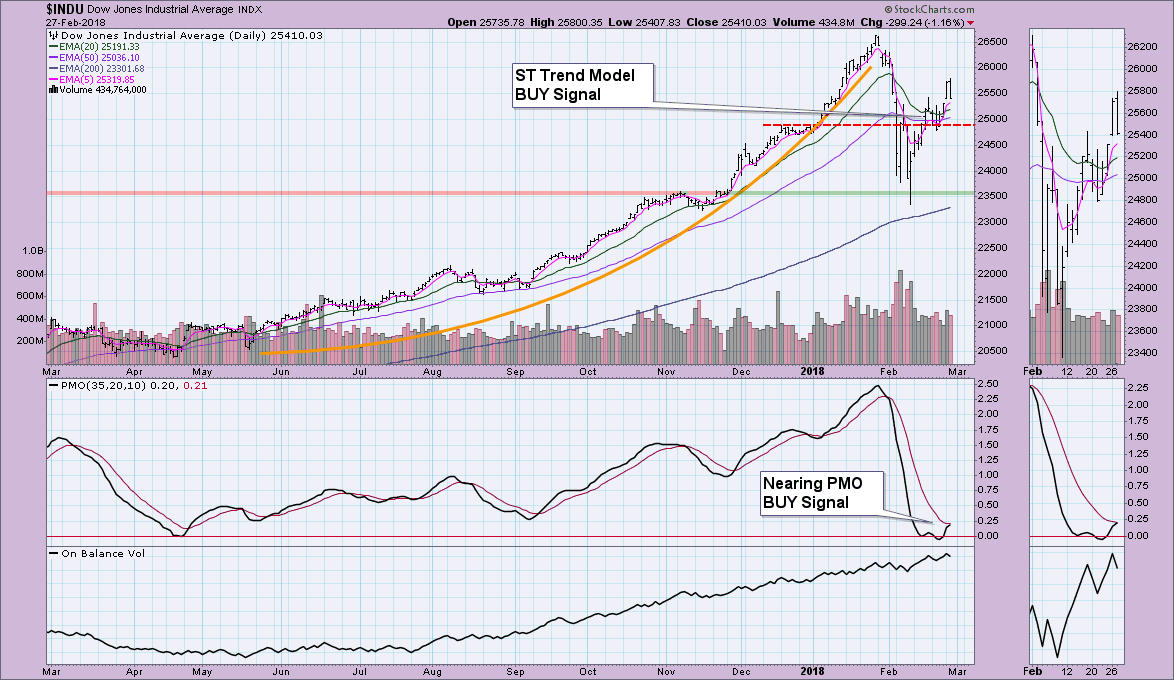
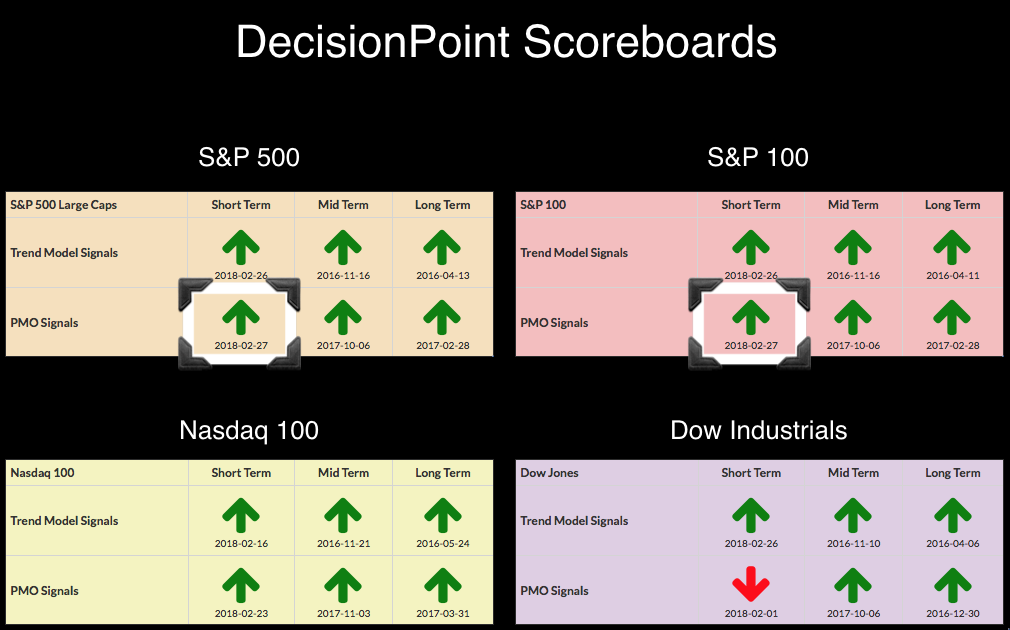
Two items I need to call your attention to. First, the PMOs crossed their signal lines on the SPX and OEX to trigger ST PMO (Price Momentum Oscillator) BUY signals. The Dow's PMO is stubbornly staying below its signal line, but that should disappear tomorrow given it's only two hundredths of a point away. That brings up item number two. I noticed clear outside reversal bars on all but the Dow.
Below are the charts for the SPX and OEX. I've also added the NDX to point out the clear outside reversal bars. This is similar to an engulfing candle, but the high on the second day must be higher than the previous day's and the low on the second day must be lower than the previous day's. The Dow didn't technically show an outside reversal day because today's low isn't lower than yesterday's. At first blush, I felt it ominously occurred after gaps up on breakouts from bullish flags and could show island reversals. However, the charts show that we could be looking at an island reversal on the Dow, but the others pretty much closed their gaps. We also see they are holding support along the declining tops lines of the flags. Should that support break down, I'd be looking for a continuation of lower prices in the short term.
Helpful DecisionPoint Links:
DecisionPoint Shared ChartList and DecisionPoint Chart Gallery
Price Momentum Oscillator (PMO)
Swenlin Trading Oscillators (STO-B and STO-V)
Technical Analysis is a windsock, not a crystal ball.
Happy Charting!
- Erin
**Don't miss DecisionPoint Commentary! Add your email below to be notified of new updates"**

