
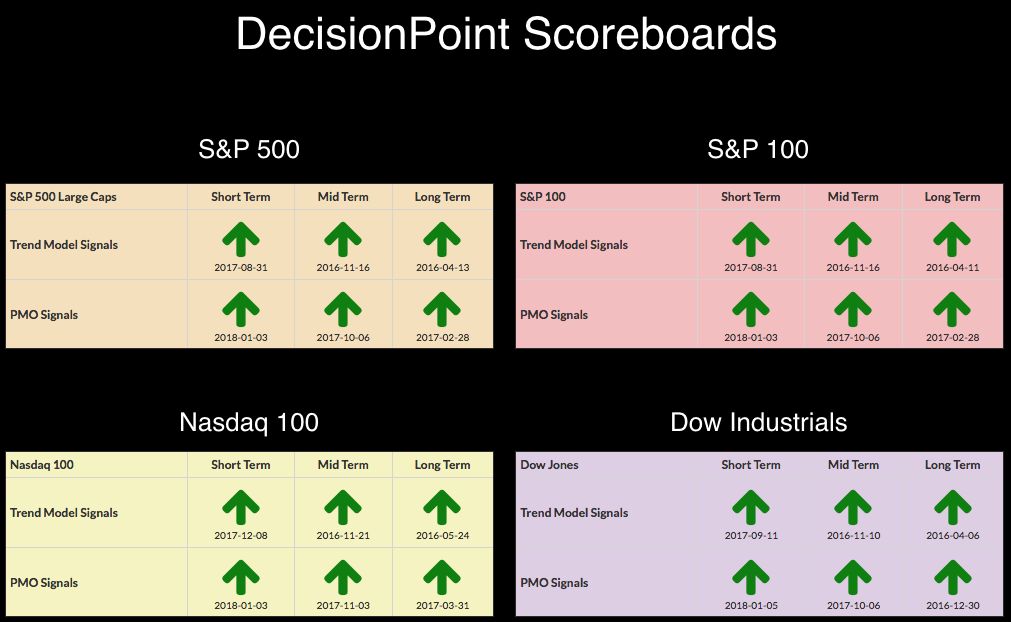
Carl always told me that you shouldn't put questions in the title of your articles unless you plan on answering them. I will. First, I want to point out the all green DecisionPoint Scoreboards. As I told listeners this morning, since I've been tracking these Scoreboards over three years, this is only the second time they have been all green; and the first time it only lasted two days and the market began to pause and top somewhat which added a few PMO SELL signals. I would look at these "all green" boards as a possible warning we will see a pause or pullback soon.
The purpose of the DecisionPoint Alert Daily Update is to quickly review the day's action, internal condition, and Trend Model status of the broad market (S&P 500), the nine SPDR Sectors, the U.S. Dollar, Gold, Crude Oil, and Bonds. To ensure that using this daily reference will be quick and painless, we are as brief as possible, and sometimes we let a chart speak for itself.
STOCKS
IT Trend Model: BUY as of 11/15/2016
LT Trend Model: BUY as of 4/1/2016
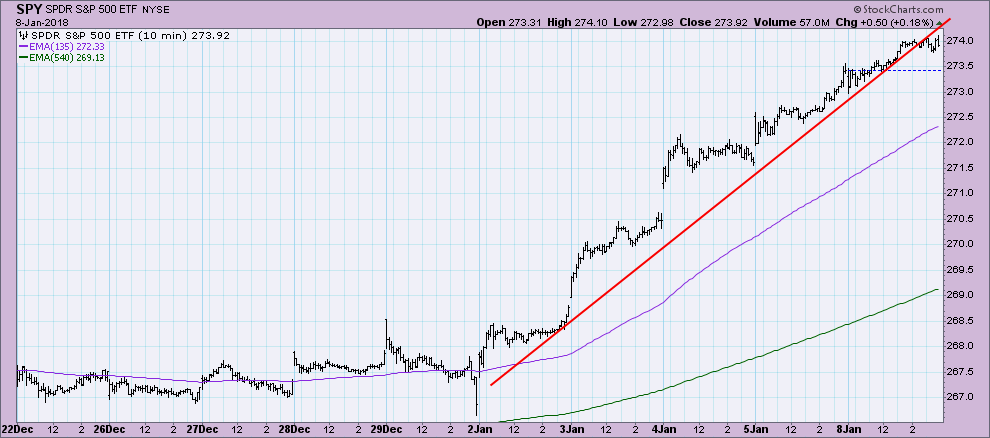
The angle of ascent is pretty clear on the 10-minute bar chart. It doesn't look that steep on this chart. Notice the "drift" that moved price below the rising bottoms trendline. I suspect we'll see more of this as the week progresses.
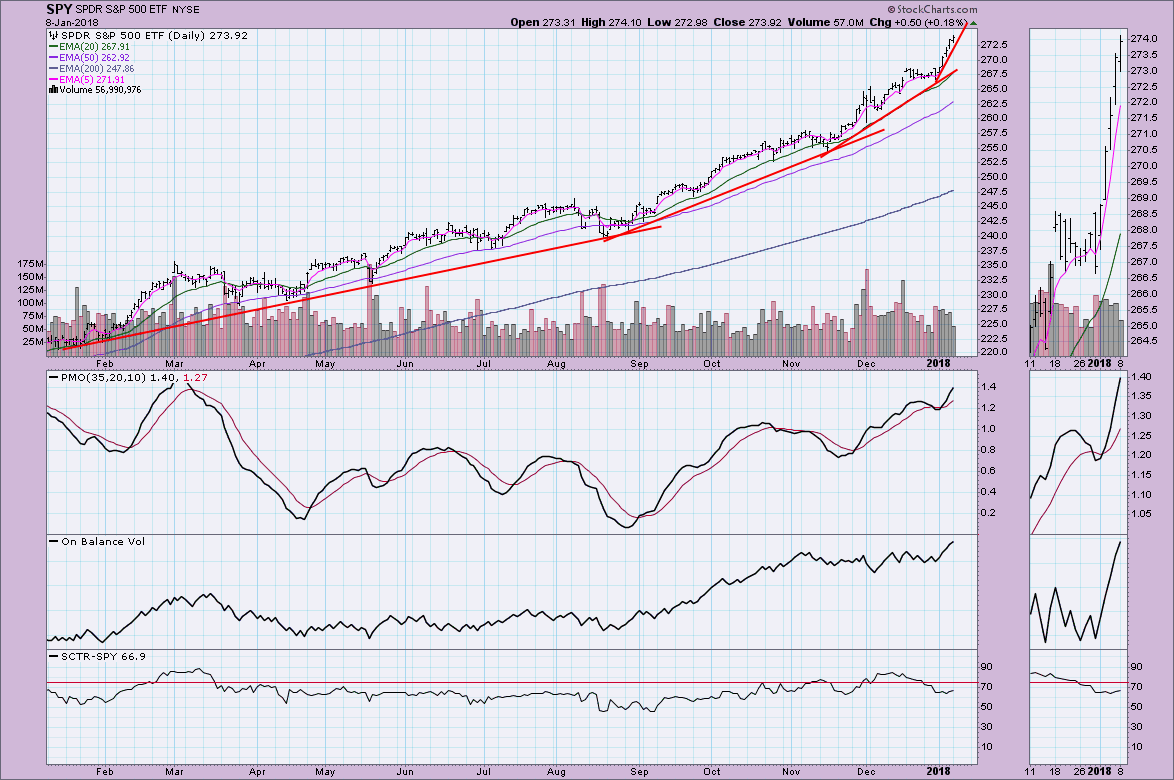
That angle of ascent looks far steeper on the daily chart and you can see why Carl and I believe it won't hold up much longer. Carl also pointed out in Friday's Weekly Wrap the parabolic that has formed on the SPY. We aren't looking for this to collapse as a typical parabolic which usually drops like a rock to the original basing pattern. Besides a parabolic shaped rally, the PMO is getting overbought. The typical range for the SPY's PMO is between -2 and +2. With a reading of 1.40, it's overbought, but not extremely so. Important to note about the PMO is that it has not been in negative territory since the election. When you see oscillators, oscillating above the zero line, that implies internal strength.
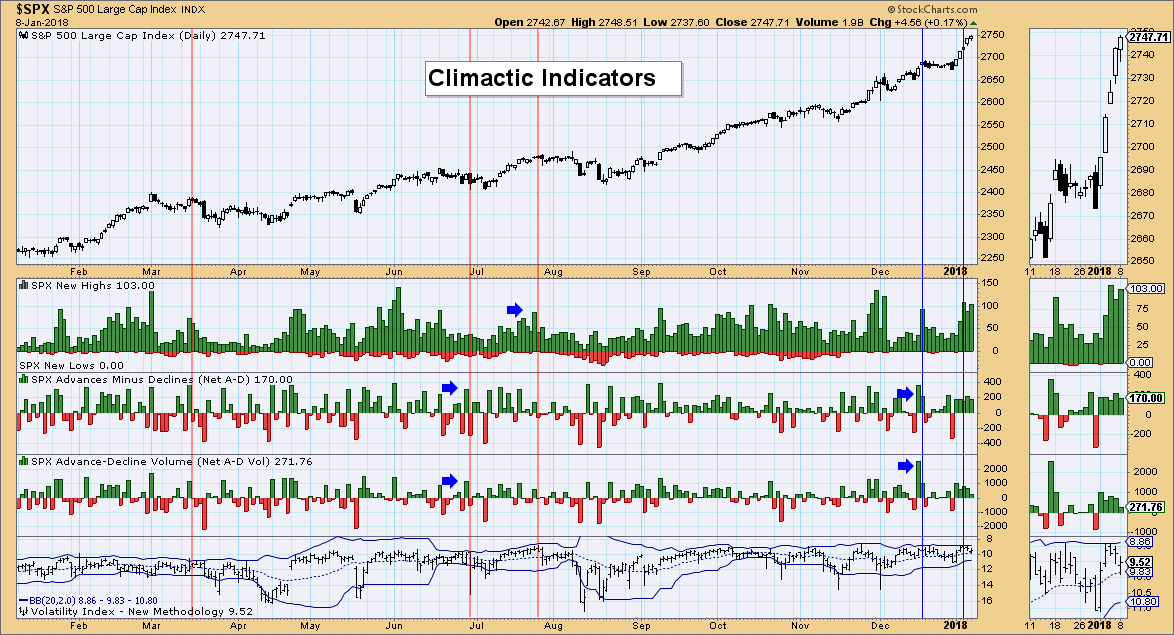
Climactic Indicators: New highs have been showing climactic readings for three days, but I'm not seeing the corresponding climactic readings on the Net A-D. The VIX is now in the middle of its Bollinger Band. Without accompanying high readings on Net A-Ds, I don't think this chart is saying much except that more are participating in this explosive rally that began last week.
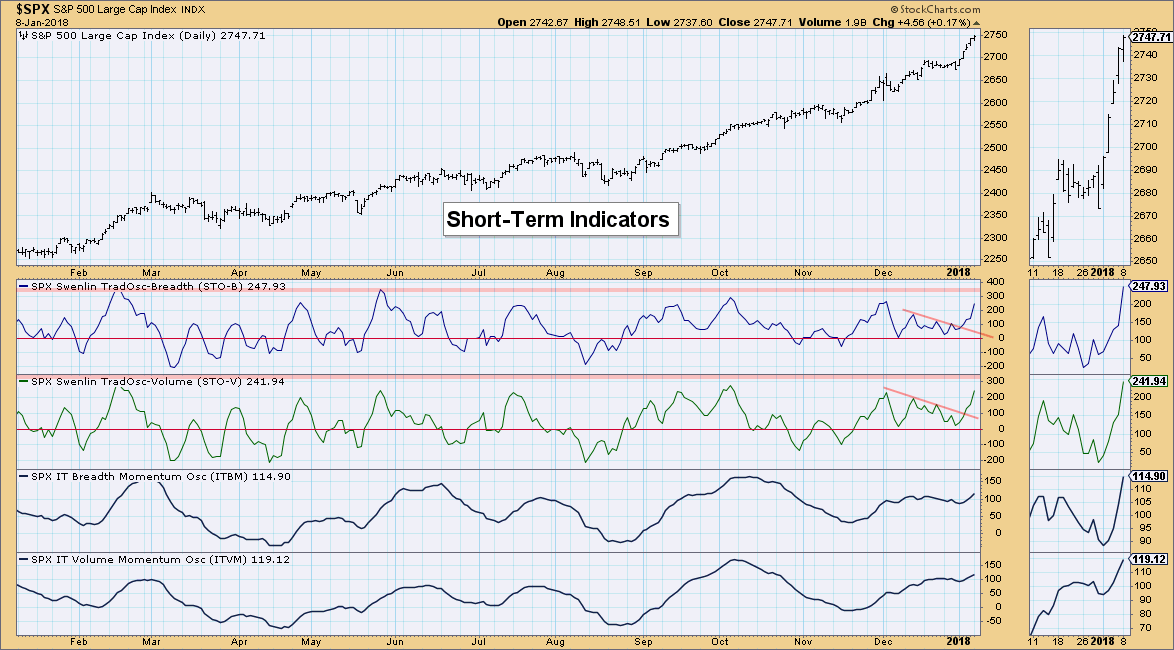
Short-Term Indicators: These look quite bullish with a new straight rise to accompany price. These indicators are reaching overbought territory, so this rally is probably ready for a rest period. Once these indicators get extremely overbought, I'd expect a pause or pullback. They don't look interested in slowing, so we may see them push into overbought territory before the end of the week.
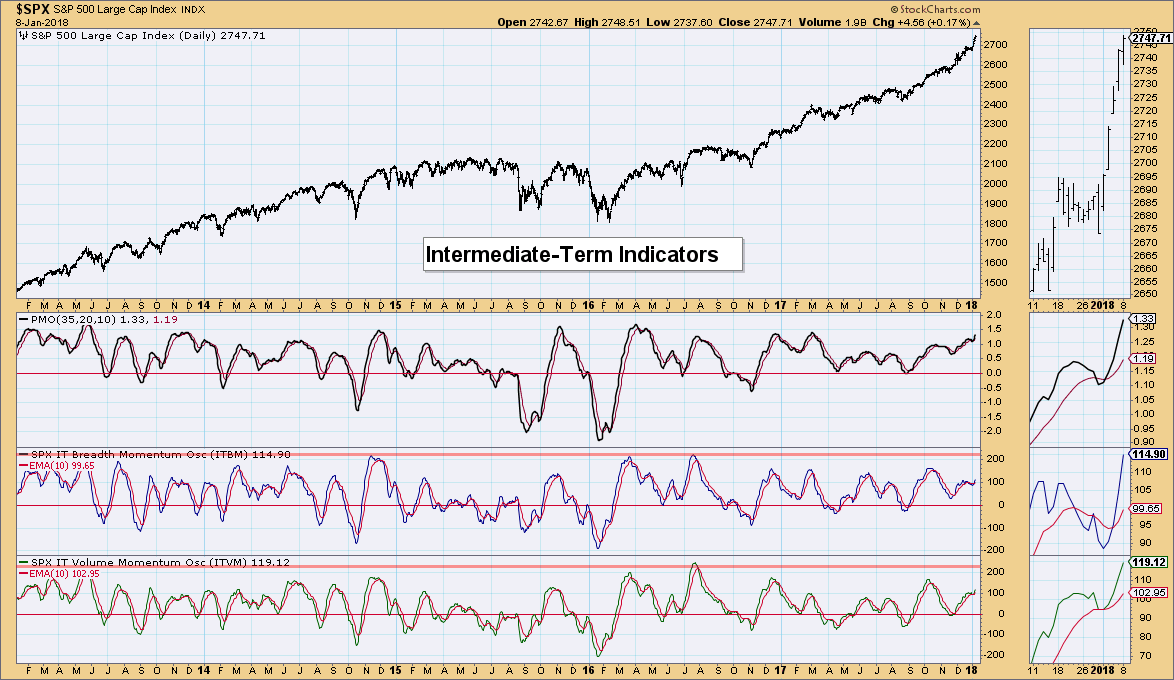
Intermediate-Term Indicators: These indicators look bullish as they rise past the previous tops in December. They aren't overbought and they do travel a bit more slowly than the Swenlin Trading Oscillators above, so I see this as bullish for the intermediate term (upcoming couple of weeks).
Conclusion: So what is the answer to the question, "Isn't it time for a pause?" I think we all would emphatically say, "yes" it needs a pause. The real question is whether we're there yet. Based on the rising short-term indicators and positive configuration of intermediate-term indicators, I'd have to we aren't quite there yet. My sense is the market will continue to rise into the week, but should begin its pause or pullback at the end of the week or beginning of next week.
DOLLAR
IT Trend Model: SELL as of 12/21/2017
LT Trend Model: SELL as of 05/24/2017
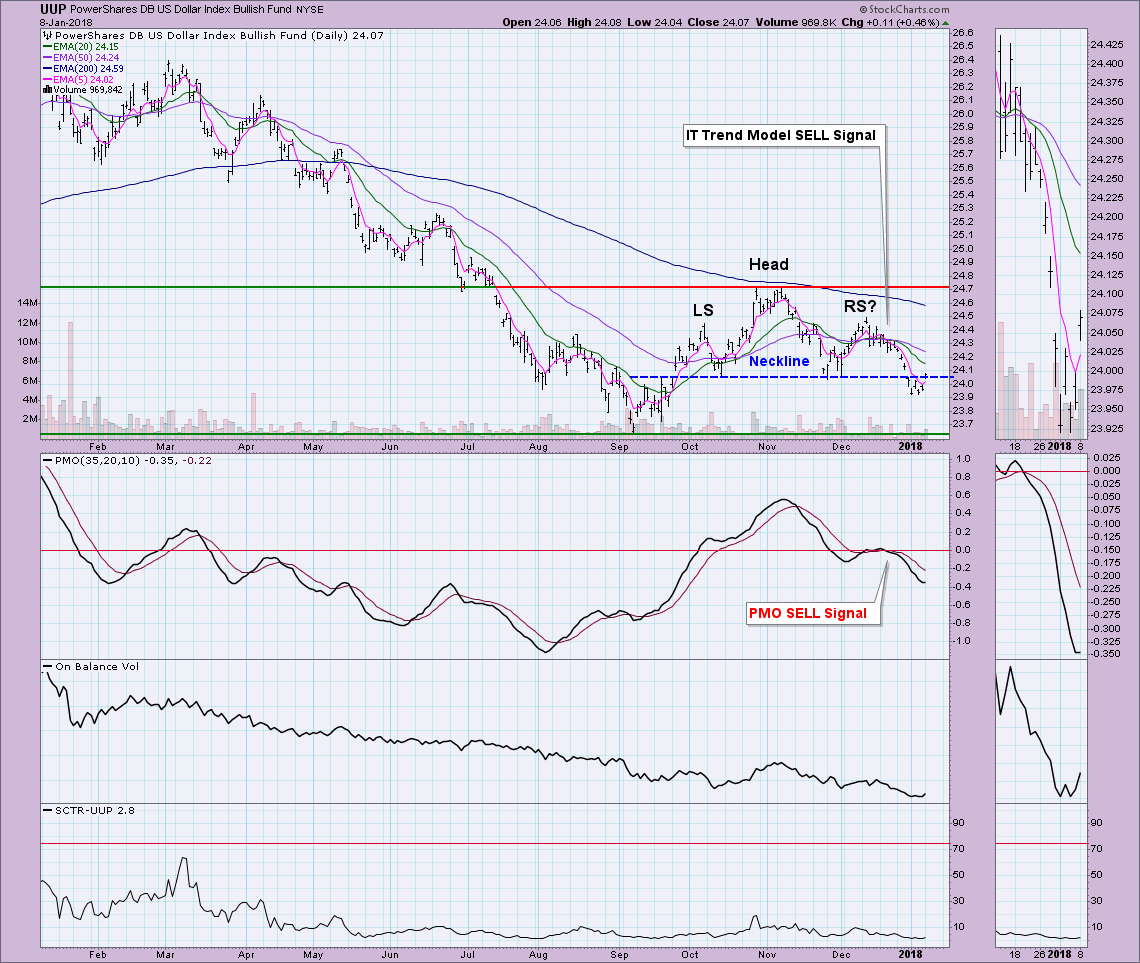
The Dollar is working very hard to get back above the neckline of the head and shoulders pattern that executed when price broke down. I think the pattern is still viable, so I'm looking for a decline back to the September low.
GOLD
IT Trend Model: BUY as of 1/2/2018
LT Trend Model: BUY as of 4/12/2017
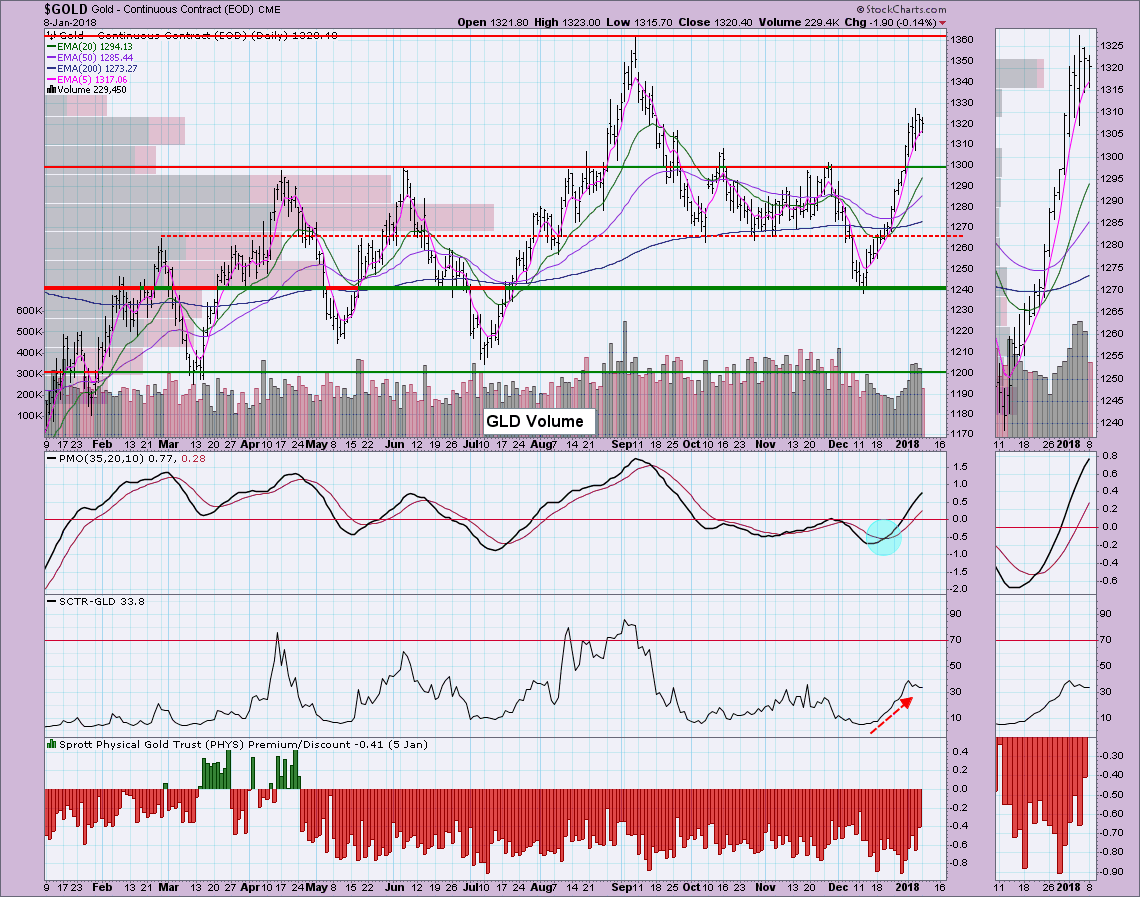
Gold price is looking a bit toppy right now, but the PMO is still healthy. The SCTR is flattening and discounts are beginning to lessen (meaning gold sentiment is getting bullish) which implies bearishness as far as Gold price is concerned. It's not hit premiums yet, so a pullback to the 1300 level may be required before it continues higher. I'm bullish Gold and am looking for a move to $1360 over the next few months.
CRUDE OIL (USO)
IT Trend Model: BUY as of 11/2/2017
LT Trend Model: BUY as of 9/7/2017
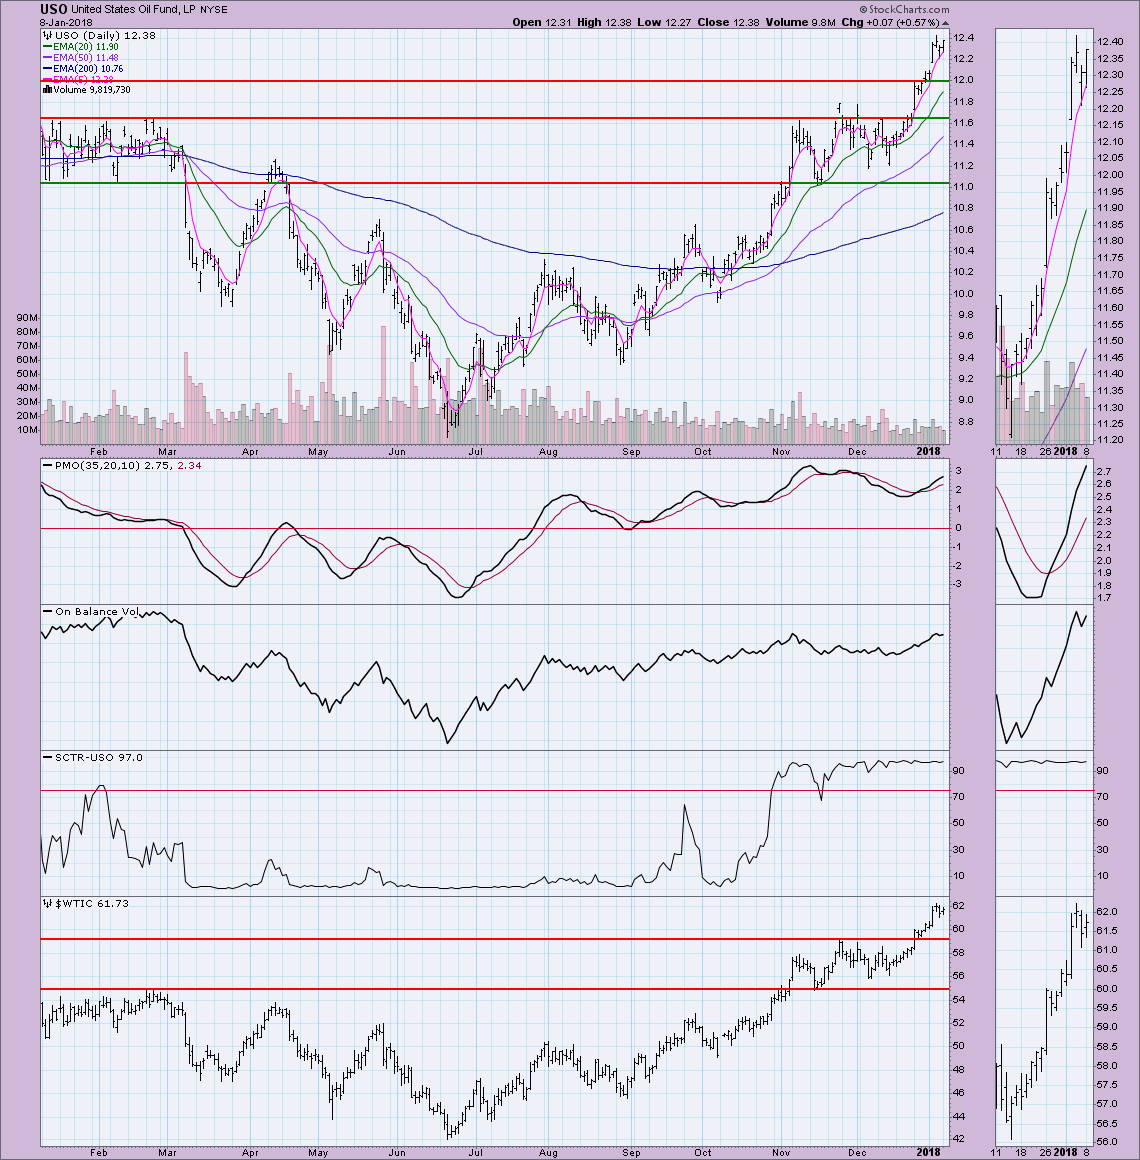
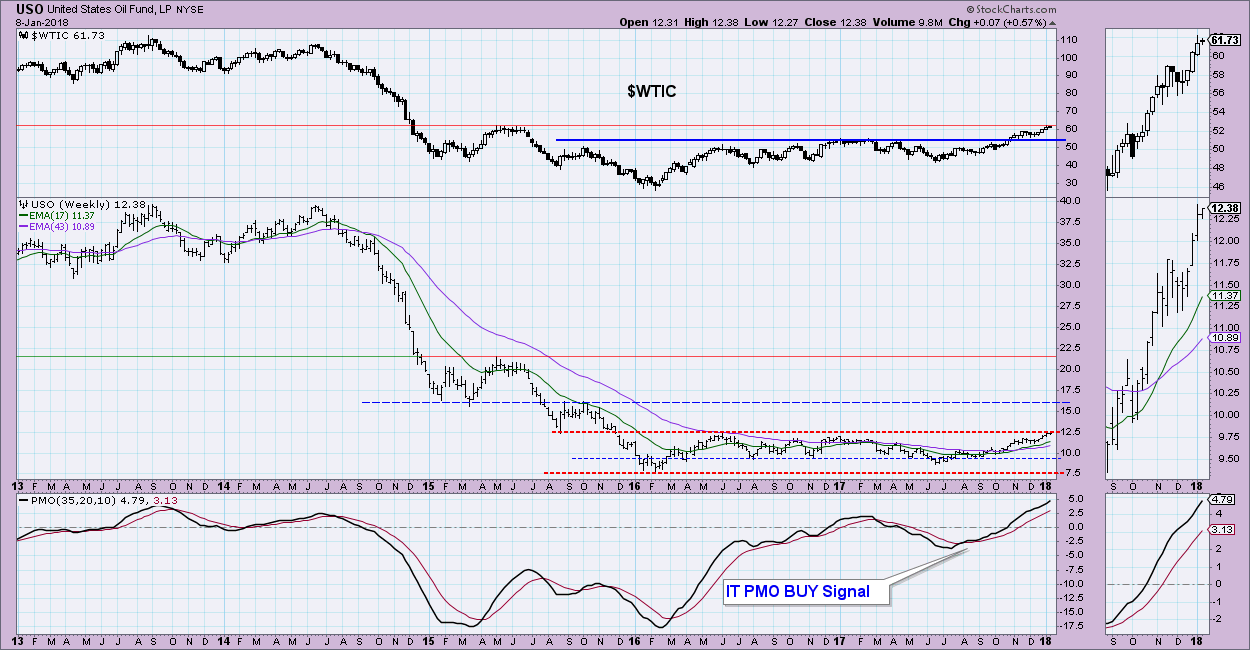
Alright. Time to answer question two from the title. I believe you could make a case for both a flag and island reversal formation on USO. Based on the price of Oil and its price formation, I'm leaning toward bull flag. The weekly chart bolsters my case.
Greg Schnell co-hosted with me on MarketWatchers LIVE and pointed out that while USO hasn't broken out above long-term overhead resistance, Oil itself has. Oil is butting up against new overhead resistance just as USO is pushing against overhead resistance. While the PMO on USO may appear overbought, it can travel higher if we're looking at a possible run-up in Oil. While this is the top of the typical weekly range for the PMO, it can stretch out. If you were to pull this chart out further, you'd see some readings around +15. This is the 'make or break' time for USO. Oil is now up against its own area of resistance and it's been since 2014 since we've seen prices above that resistance level. If we begin to see the daily and weekly PMOs turn over, it'll be time to worry. At this point, positive momentum is strong.
BONDS (TLT)
IT Trend Model: BUY as of 11/8/2017
LT Trend Model: BUY as of 6/16/2017
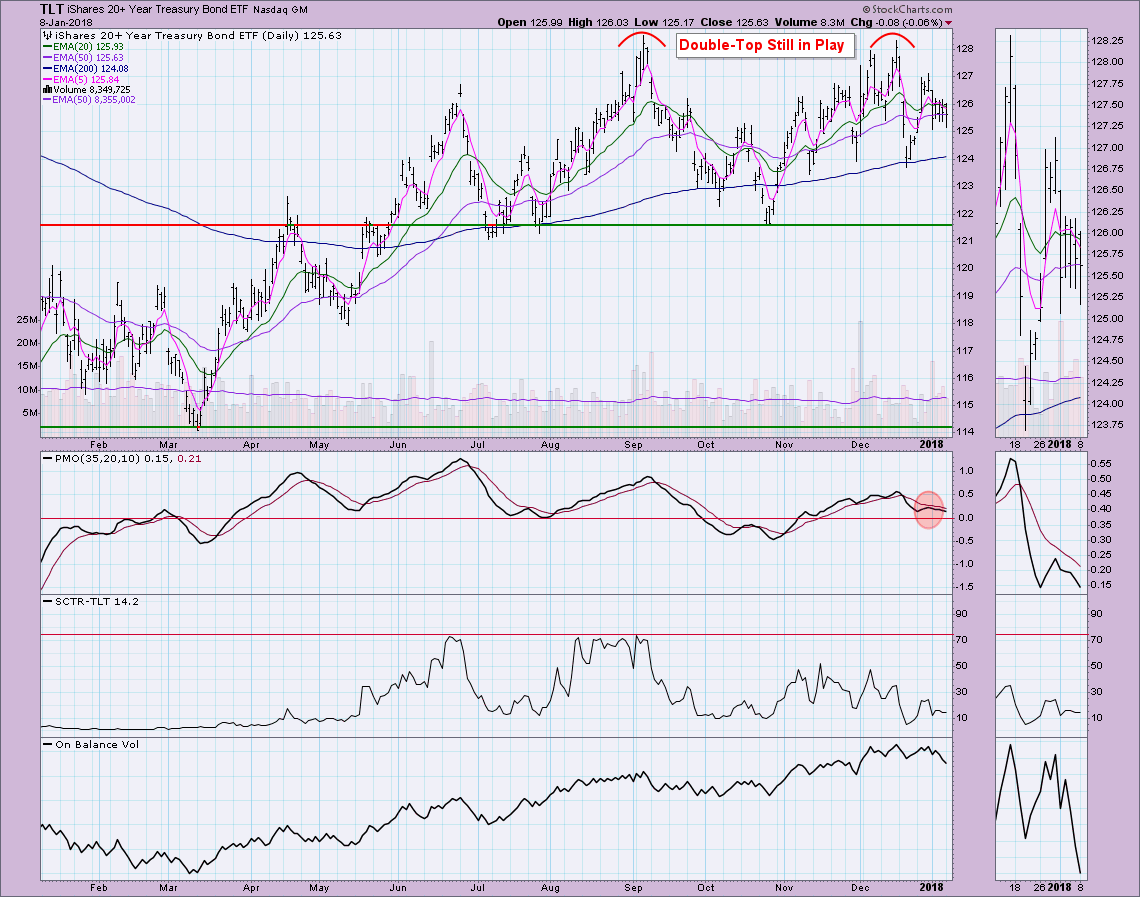
I agree with Carl that we have a double-top in play. The PMO top below the signal line and declining OBV suggest prices will probably continue to decline. I'd look for a drop to the 200-EMA at a minimum.
Helpful DecisionPoint Links:
DecisionPoint Shared ChartList and DecisionPoint Chart Gallery
Price Momentum Oscillator (PMO)
Swenlin Trading Oscillators (STO-B and STO-V)
Technical Analysis is a windsock, not a crystal ball.
Happy Charting!
- Erin
**Don't miss DecisionPoint Commentary! Add your email below to be notified of new updates"**

