One of my favorite segments to do and watch on the MarketWatchers LIVE show M-F 12:00p - 1:30p EST is the "Anatomy of a Trade". Tom Bowley, my co-host, is a very short-term trader and generally has a handful of trades to discuss. However, I'm not nearly as active as Tom so I usually go through a "paper trade" to explain my trading strategy. Today's blog article is based on a paper trade.
One thing to always remember is to stick to your strategy and not get too emotionally involved in a trade--easier said than done, right? I'm going to run through a trade as it happened and explain my thought process through each step. Here is a rough idea of my steps:
- Find investment prospects using my PMO scan, visual weeding using 10-per page or CandleGlance
- Once I have my 'pick', I set a target and a stop. These can be mental or hard limits/stops.
- Follow up when target or stop has been reached (price alerts!) and reevaluate the position.
- If it still looks good, set a new target and stop.
- Repeat until you are out.
Seems simple enough, but it isn't always.
Kelly Services (KELYA) was my Monday set-up this week. While I was checking the chart, I decided it had a great learning set-up for Anatomy of a Trade. This is a paper trade. I do not currently own KELYA.
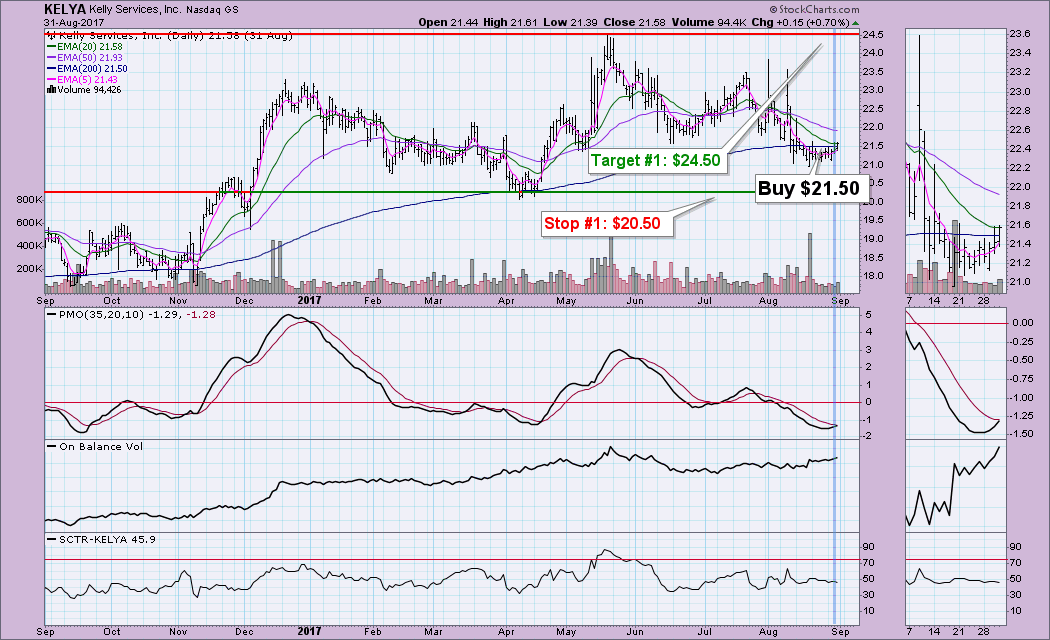
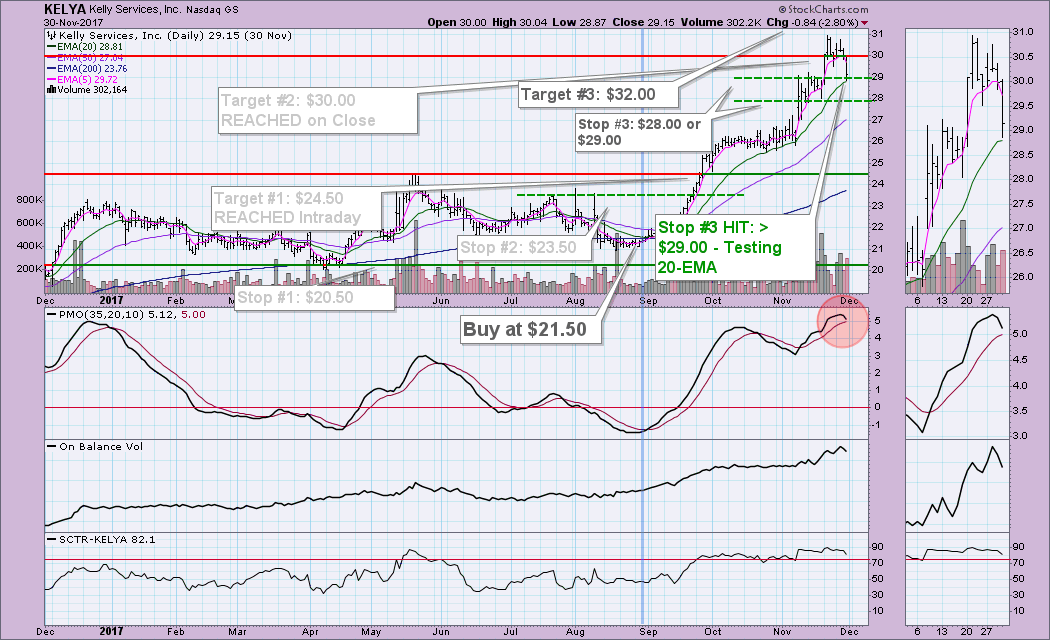
In late August, KELYA would've landed on my radar based on my PMO scan. I would've gotten in around $21.50. Let's progress through time...
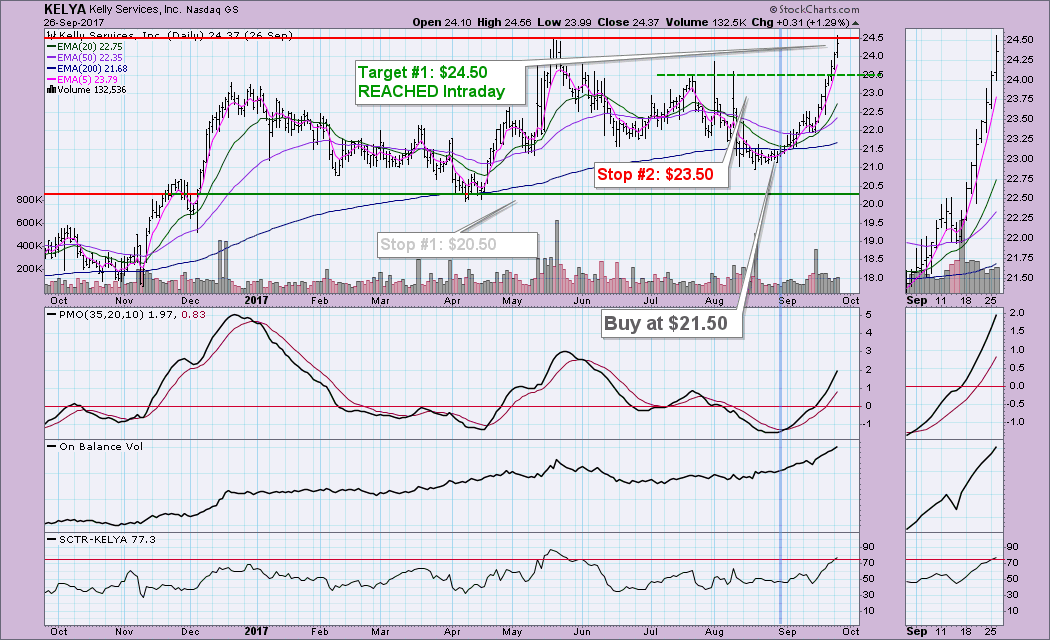
On 9/26, the first target has been hit intraday. Time to re-evaluate the trade. The PMO still looks very strong. Given the parabolic move, I would set my stop to $23.50. I might consider at this point to sell half of my position to lock in the profit, but with indicators looking so good, I'd likely let it ride. I chose $23.50 because it lines up with July/August tops. The question now is how do I pick a target, KELYA is above resistance on the chart. This is when I would turn to my trusty monthly chart.
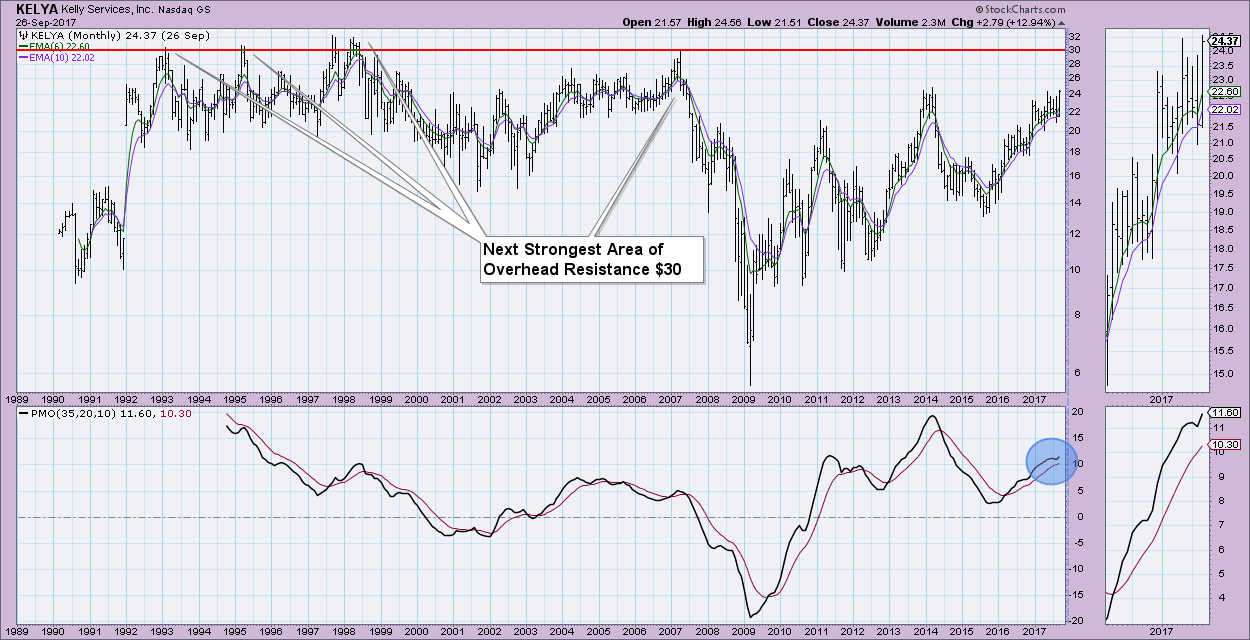
I would be a bit concerned about current overhead resistance that is being tested on the monthly chart, but the monthly PMO turning back up with ease would be comforting. I would choose the next area of strongest overhead resistance as the new target around $30.00.
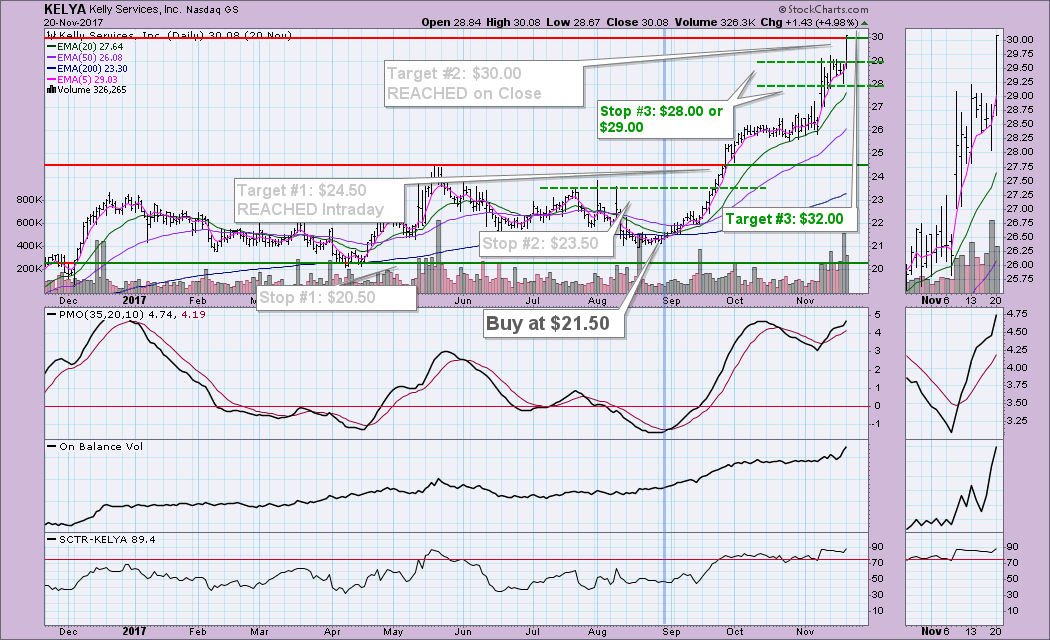
Okay, KELYA is continuing to go the direction I like and it has hit my target again! Yay! Time to reevaluate. At this point I would say that I would be using a "mental" stop between $28 and $29. Depending on how risk averse you are, select the risk reward you are comfortable with. Since it hit my target so quickly, I would expect a pullback. The 20-EMA is my mental stop and is a moving target which is why I would set the stop around $28.50 (split the difference of the trading range) until I had more information. Given the overbought PMO, I might consider selling part of my position, but the indicators still look very strong, so I'd likely hang on to the full position. My new target would now be at $32 based on the all-time high for KELYA on the monthly chart above.
Uh oh, it has dropped back to the $29 mark of my stop. It's still holding the 20-EMA but with a PMO that ugly and the amount of profit I'd already reached, I'd bail out. Selling at about $29 for a tidy gain of more 34%. This is an extremely successful trade and not typical. Hindsight is also 20/20...I was able to look at the whole chart and know this was going to be a good trade. I did trade ETSY, a MWL Monday Set-Up recently and had a similar gain. Right place at the right time...that's what my PMO scan does for me. I'll be talking about how to weed your scan results in another article.
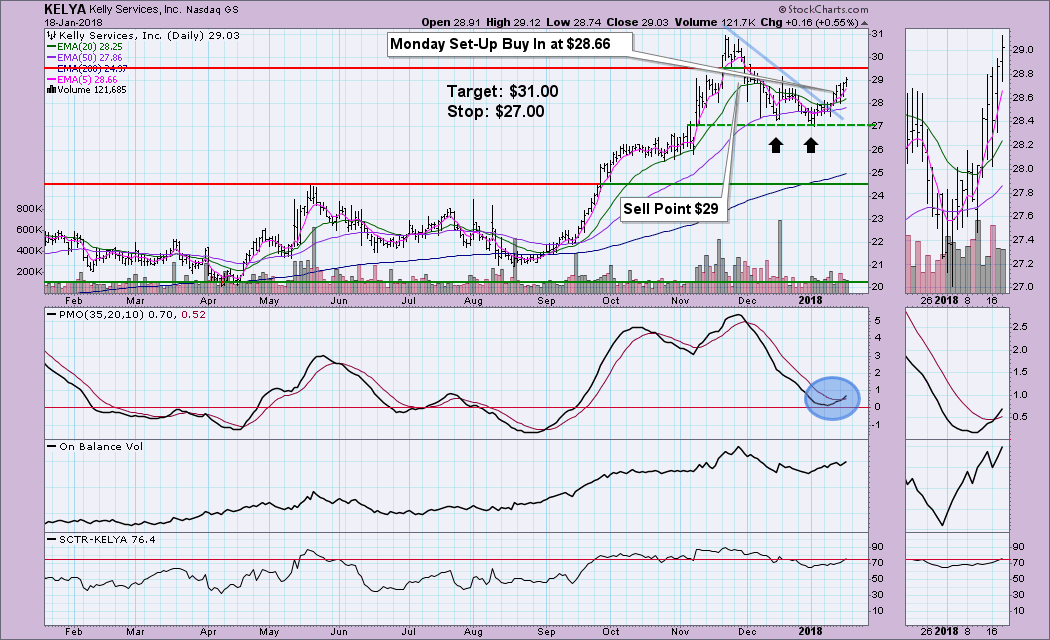
As we can see after hitting that $29 level, the correction was on. KELYA dropped back on my radar on Tuesday when searching for this week's Monday Set-Up for MarketWatchers LIVE. I liked the recent breakout from the declining tops trendline and the double-bottom that formed. I'd set the target at overhead resistance at $31 and the stop around $27. However, currently price is getting ready to test overhead resistance at the neckline of $29. If that were to fail as well as a failure at the 20-EMA, I'd likely get out even though the 'official' stop wasn't hit. Again, most of my stops are mental and do allow for reevaluation.
Conclusion: I hope that was helpful. I'm asked constantly about this type of analysis and generally I shy away from it because I'm not a day or short-term trader as a rule. MarketWatchers LIVE has tested my analysis ability and sticking to my trading strategy. You'll find my PMO Scan here. It's a great place to start. If you would like me to do more Anatomy of a Trade articles, let me know! I think next time I'll show a not so great trade or update you on this current Monday Set-Up as it goes along.
Helpful DecisionPoint Links:
DecisionPoint Shared ChartList and DecisionPoint Chart Gallery
Price Momentum Oscillator (PMO)
Swenlin Trading Oscillators (STO-B and STO-V)
Technical Analysis is a windsock, not a crystal ball.
Happy Charting!
- Erin
**Don't miss DecisionPoint Commentary! Add your email below to be notified of new updates"**

