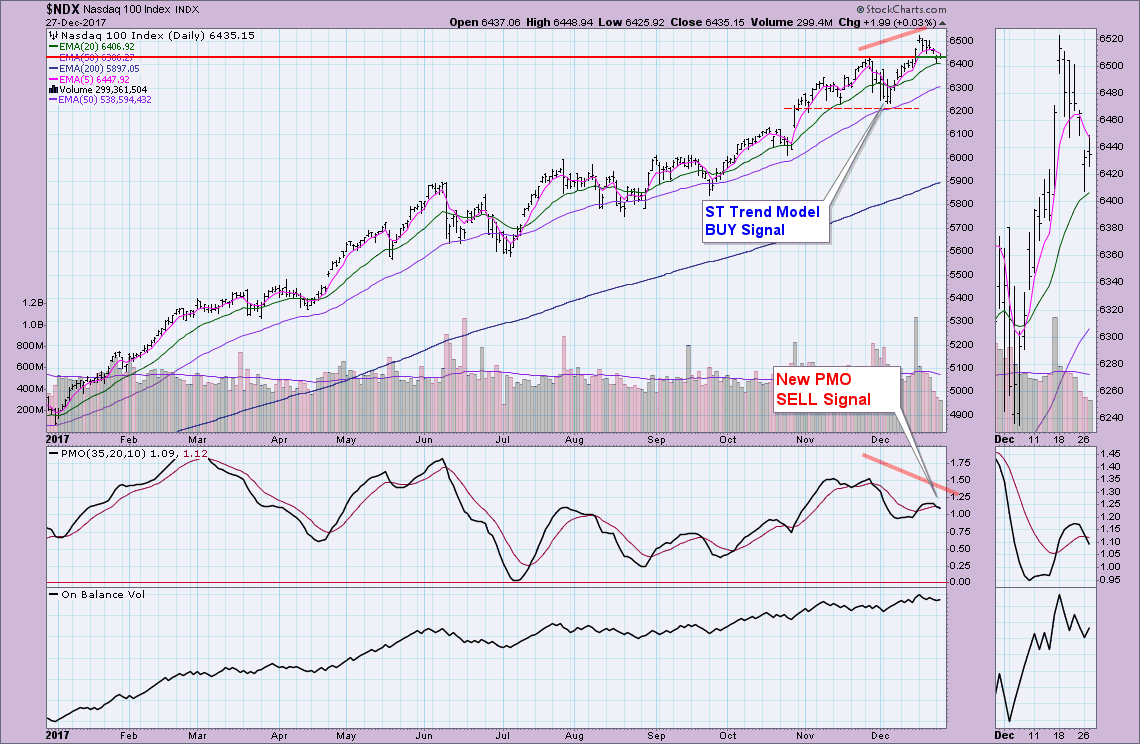

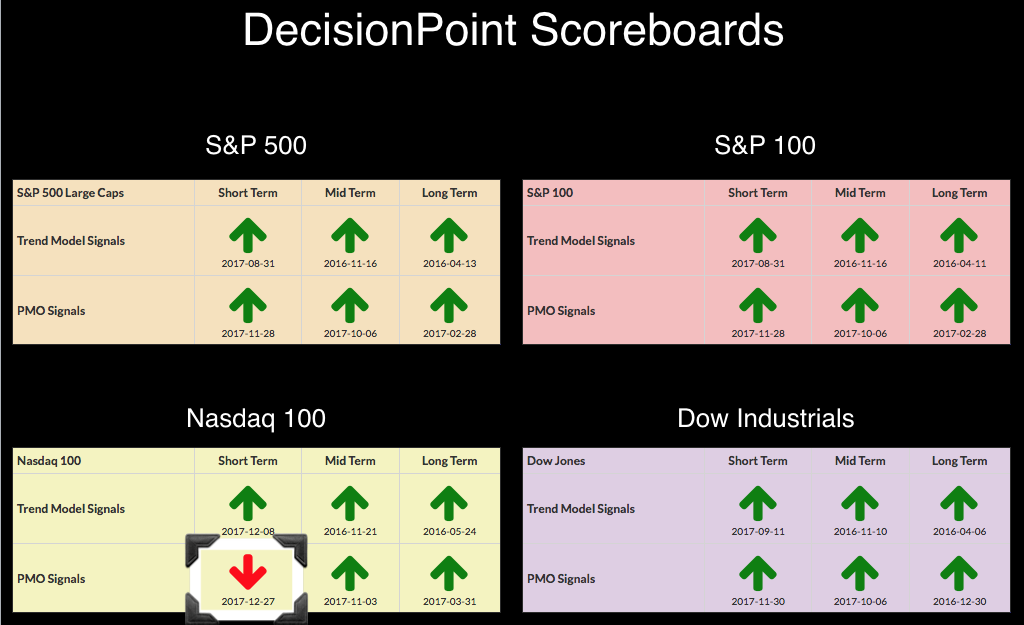
I hope you and yours had a fantastic and warm Christmas! As Bob Cratchit so eloquently put it, "I was making rather merry yesterday". The holidays continue as does holiday trading into the new year. We received a new PMO SELL signal on the NDX, so I've updated the DP Scoreboards accordingly. The market is taking a pause, as is the NDX which likely accounts for the drop in positive momentum. For the NDX, the PMO never really had an opportunity to put distance between it and its signal line which also contributed to the signal change. The 20-EMA is holding for the NDX, but the negative divergence between the PMO and price tops is stark and does suggest we could see another test of that support.
The purpose of the DecisionPoint Alert Daily Update is to quickly review the day's action, internal condition, and Trend Model status of the broad market (S&P 500), the nine SPDR Sectors, the U.S. Dollar, Gold, Crude Oil, and Bonds. To ensure that using this daily reference will be quick and painless, we are as brief as possible, and sometimes we let a chart speak for itself.
STOCKS
IT Trend Model: BUY as of 11/15/2016
LT Trend Model: BUY as of 4/1/2016
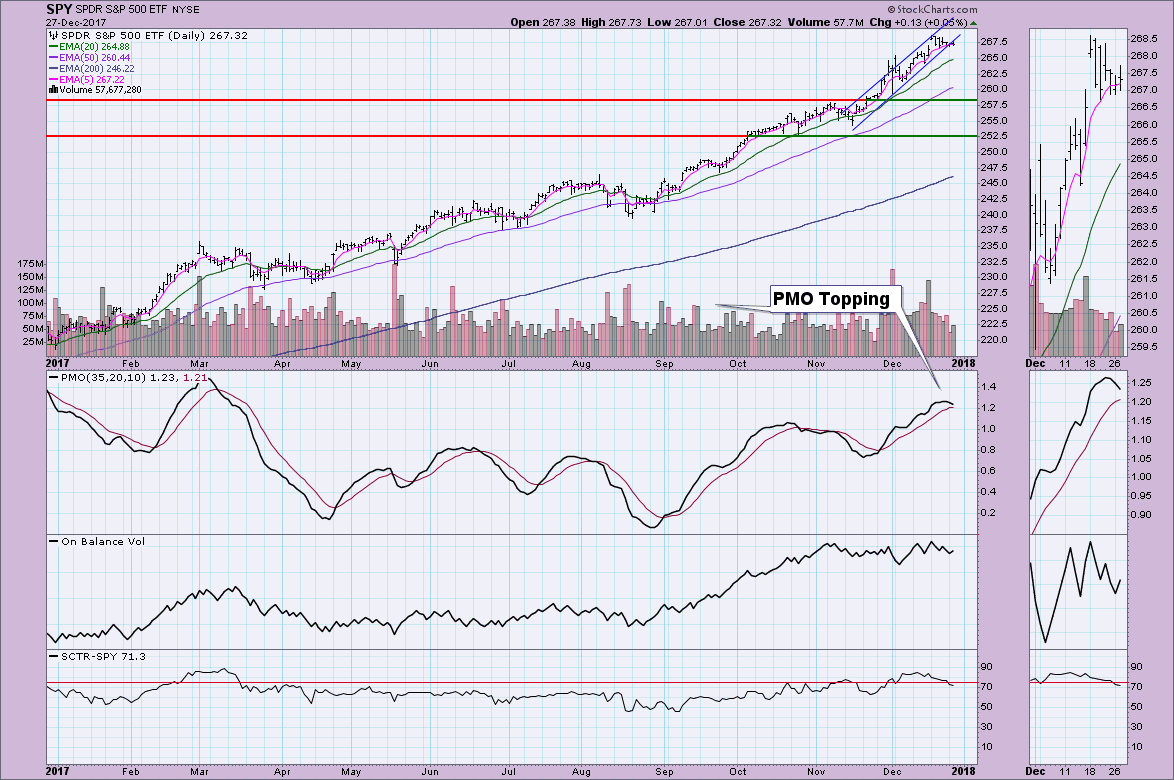
Since attacking the all-time high last week, price pulled back to support and has been consolidating so far this week.
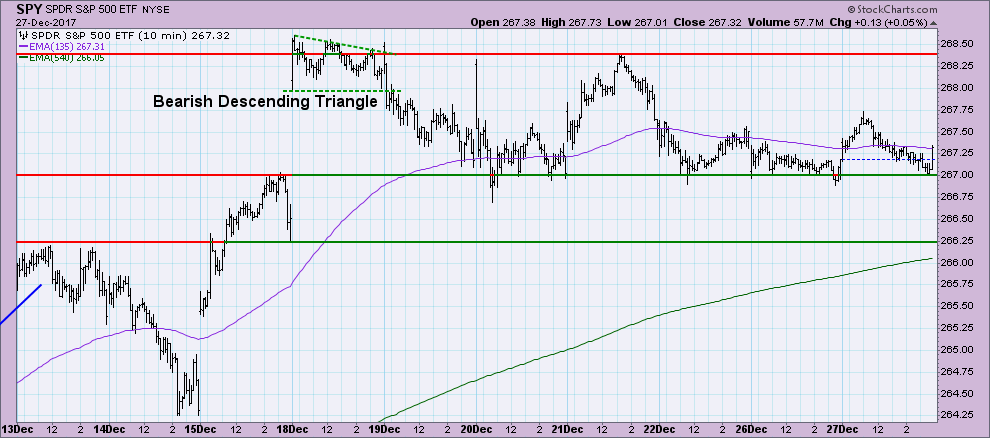
Trading is very light. Price is pushing outside the rising trend channel, but support is holding nicely as noted on the 10-minute bar chart above. The PMO has topped, suggesting we could see a bit more than sideways consolidation. We'll have a better idea when the holidays are behind us and regular trading begins in earnest. The indicators are hinting that in the short term, we should be okay...intermediate term is more murky and I'll explain.
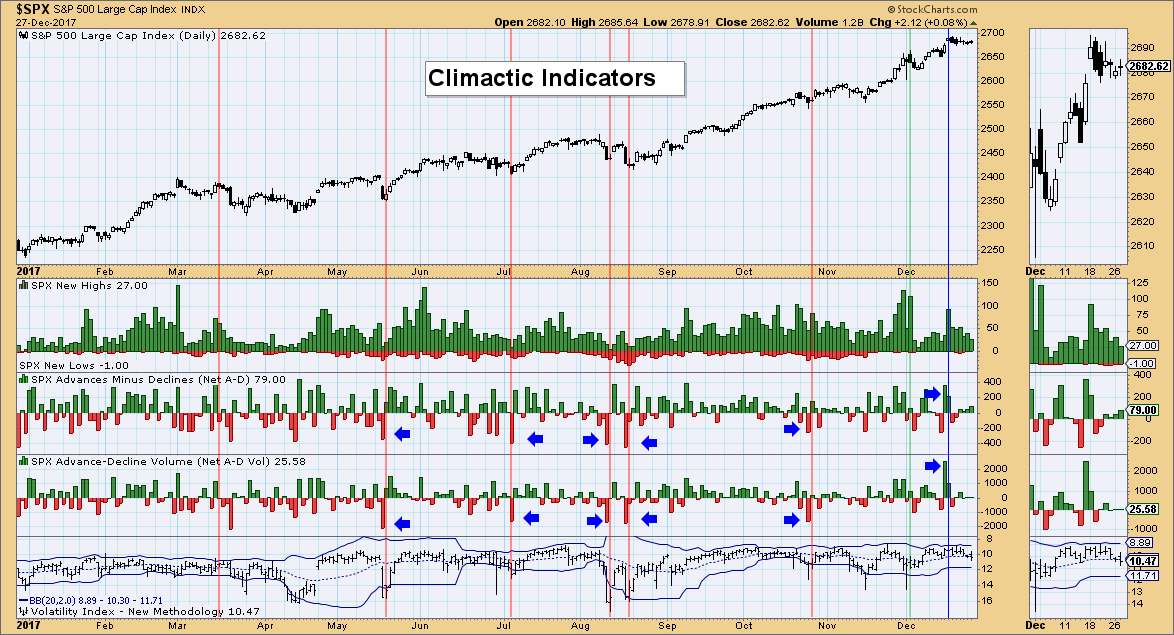
Climactic Indicators: We're not getting much in the way of information on these indicators. They "work" when we get climactic readings and at this point, we don't have that.
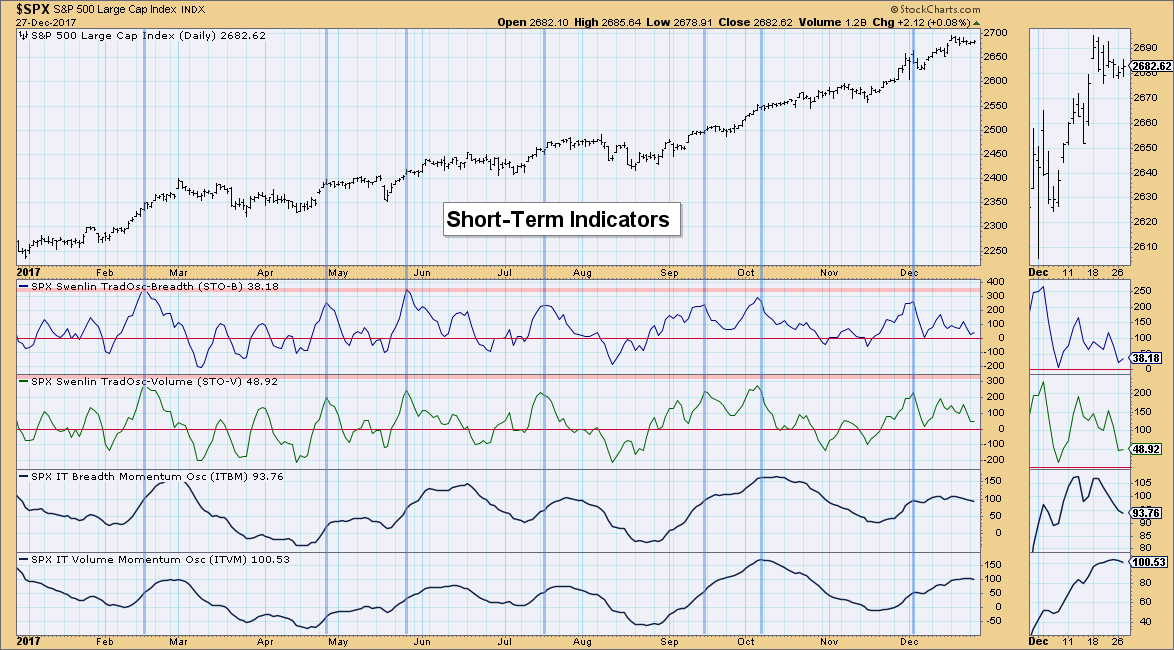
Short-Term Indicators: These indicators appear to be rising again with a possible reset after testing the zero line. A little more upside will give me more confidence in this new indicator bottom on the STOs. We do see "twitch" on these indicators so I want to see a more 'deliberate' move. This is very encouraging though.
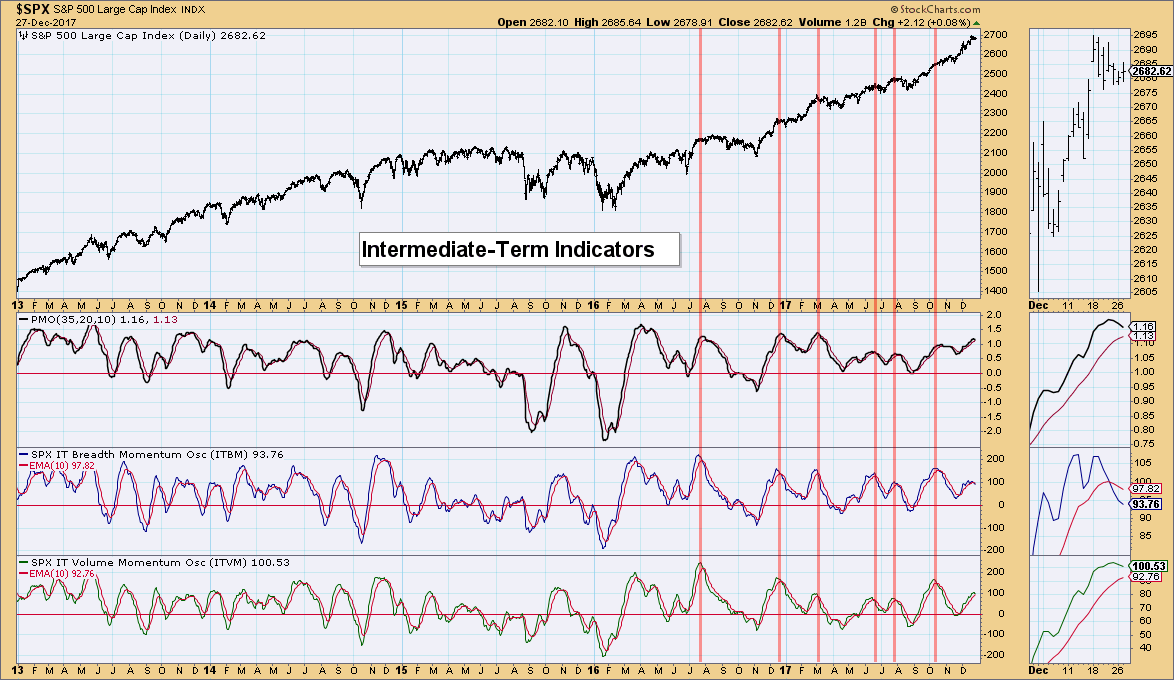
Intermediate-Term Indicators: We got the negative crossover on the ITBM but the ITVM so far is avoiding that crossover. I've annotated the last few times we seen both top and decline after negative crossovers. These indicators are usually right on. If we get a negative crossover on the ITVM, it'll be time to get more worried.
Conclusion: Holiday trading has slowed momentum on the major indexes and consequently we saw a new PMO SELL signal on the NDX. The PMO on the SPY has also topped, but I believe there is enough margin for that signal to be preserved if short-term indicators are correct and we get a new rally this week or next. IT indicators are worrisome, but we haven't gotten that final negative crossover on the ITVM so I can't get too bearish.
DOLLAR
IT Trend Model: SELL as of 12/21/2017
LT Trend Model: SELL as of 05/24/2017
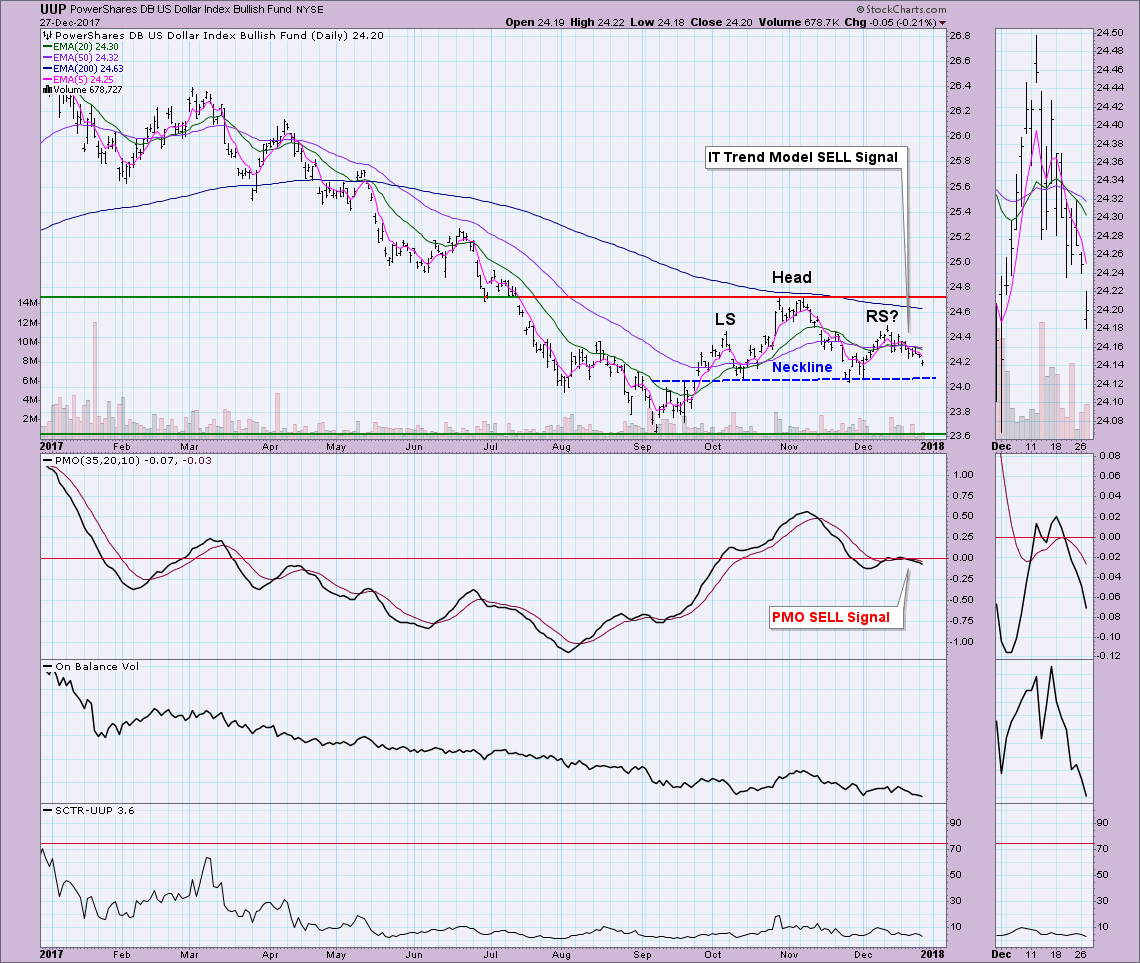
The short-term head and shoulders continues to form on UUP. It isn't an official pattern until it executes. An execution of the pattern occurs when the neckline is broken. Should we see that, the minimum downside target would exceed this year's low. The PMO SELL signal and completely bearish configuration of the EMAs tells me to expect that drop to at least the September low.
GOLD
IT Trend Model: NEUTRAL as of 10/20/2017
LT Trend Model: BUY as of 4/12/2017
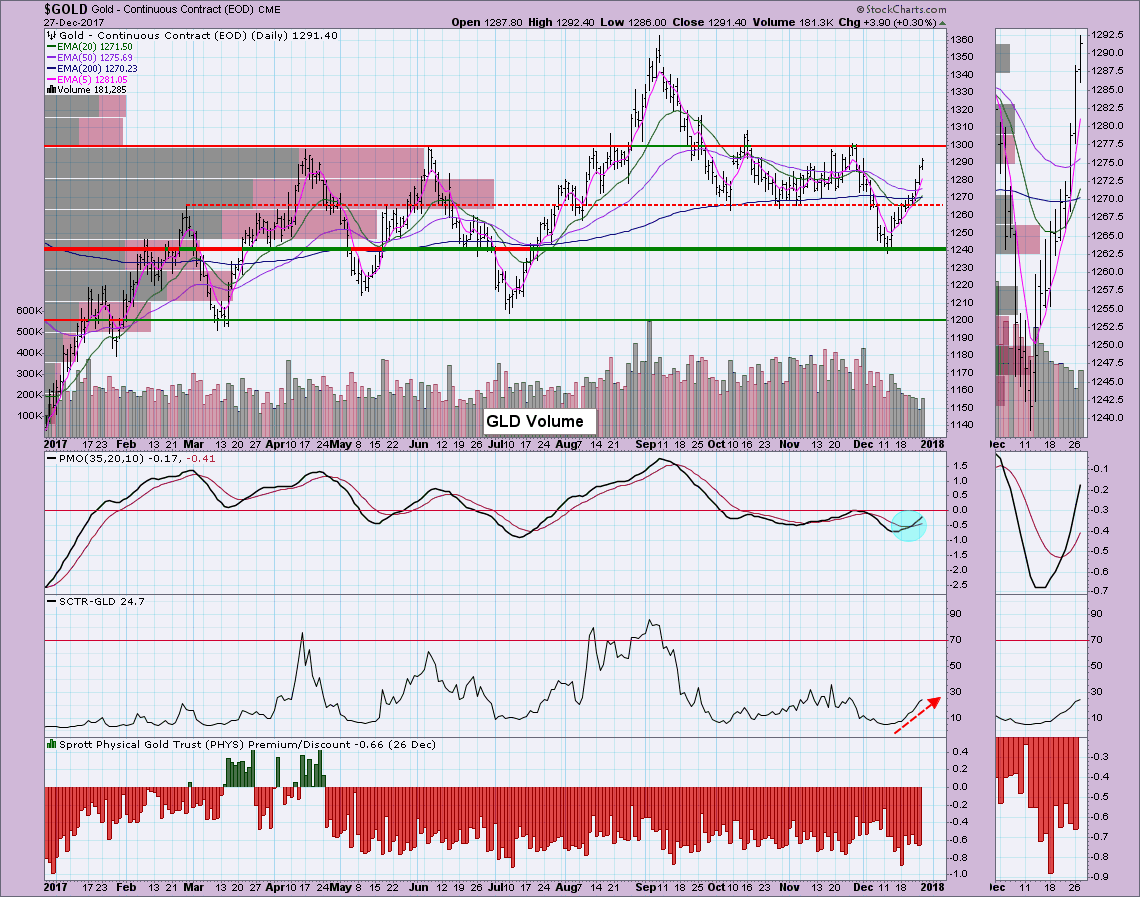
After bouncing off the volume by price area around 1240, the rally has been on. The 50-EMA was able to hold above the 200-EMA so Gold is configured bullishly. However, we're getting ready to reach the 1300 level and that has held tight all year with the exception of the rally continuation in September. I would expect a pullback at 1300. With the new PMO BUY signal and bullish confirmation of the SCTR, I don't think 1300 will hold up as resistance much longer so another test will likely be successful.
CRUDE OIL (USO)
IT Trend Model: BUY as of 11/2/2017
LT Trend Model: BUY as of 9/7/2017
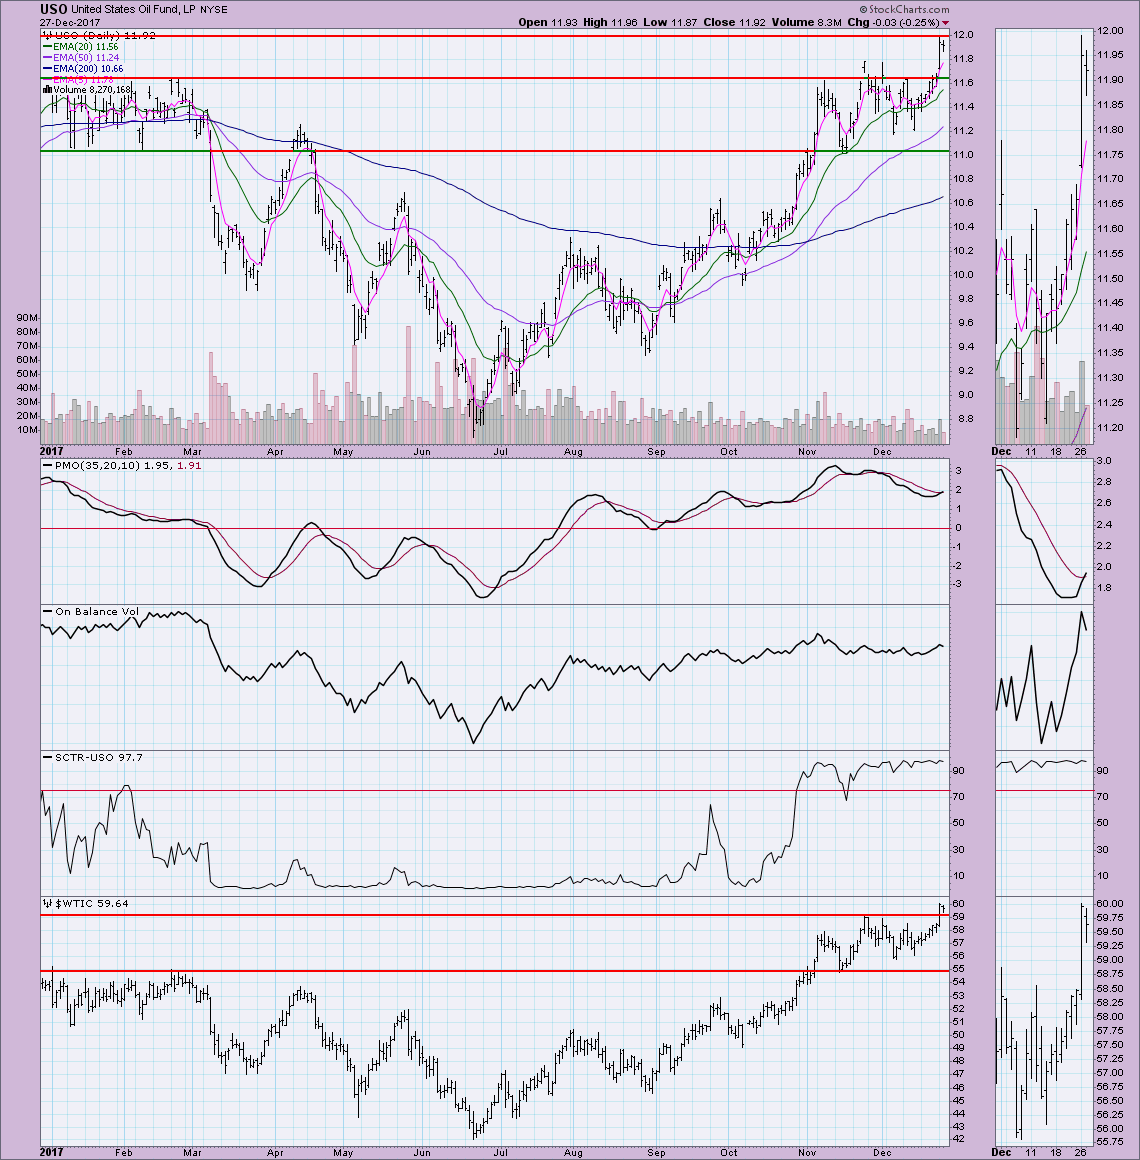
New PMO BUY signal for USO today! We've already seen a tremendous breakout and price has stopped at $12. Like Gold, now that this area of overhead resistance has finally been reached, I'd expect a pullback or pause before price can successfully push past the $12 level.
BONDS (TLT)
IT Trend Model: BUY as of 11/8/2017
LT Trend Model: BUY as of 6/16/2017
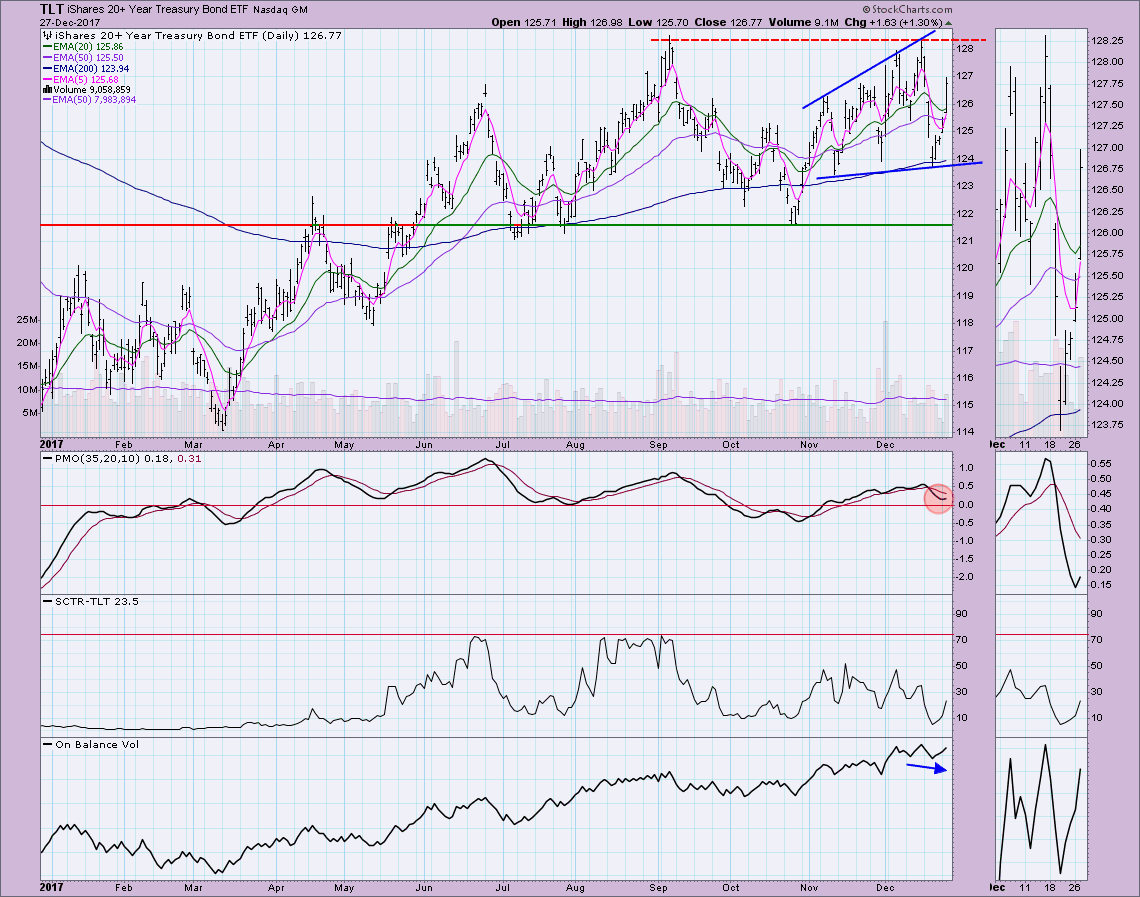
TLT had a very profitable day with a 1.3% rise. It appears the $128 level will be tested yet again. It appears we are looking at a broadening pattern (like a megaphone or horn) which is typically bearish. The PMO ticked up with today's big move, so we should see price test overhead resistance at the September top. I'd also like to see rising bottoms on the OBV to match the bullish behavior of the SCTR.
Helpful DecisionPoint Links:
DecisionPoint Shared ChartList and DecisionPoint Chart Gallery
Price Momentum Oscillator (PMO)
Swenlin Trading Oscillators (STO-B and STO-V)
Technical Analysis is a windsock, not a crystal ball.
Happy Charting!
- Erin
**Don't miss DecisionPoint Commentary! Add your email below to be notified of new updates"**

