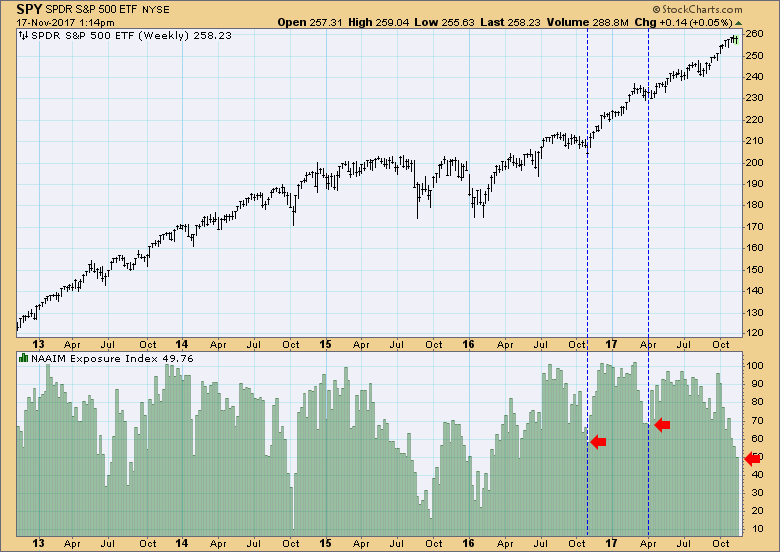
When I posted the NAAIM (National Association of Active Investment Managers) Exposure Index this week, I thought to myself, "What's wrong with this picture?". To clarify, rather than stay fully invested all the time, NAAIM members adjust their exposure based upon their assessment of market conditions, and exposure can be anywhere from +200% to -200%. Although, the Exposure Index has never been anywhere close to those extremes, it does, however, give a good reading of sentiment among this group of professionals.
What I noticed is that NAAIM exposure has pulled way back to 50% at a time when the market continues to trend upward. Looking at two previously low readings, we can see that the reduction in exposure at those times was in response to price pullbacks, so I assume that this time NAAIM members are anticipating a market decline rather than responding to one. Since extreme sentiment readings are usually contrarian, on that basis it is likely that the market is going to move higher.
The DecisionPoint Weekly Wrap presents an end-of-week assessment of the trend and condition of the stock market (S&P 500), the U.S. Dollar, Gold, Crude Oil, and Bonds.
STOCKS
IT Trend Model: BUY as of 11/15/2016
LT Trend Model: BUY as of 4/1/2016
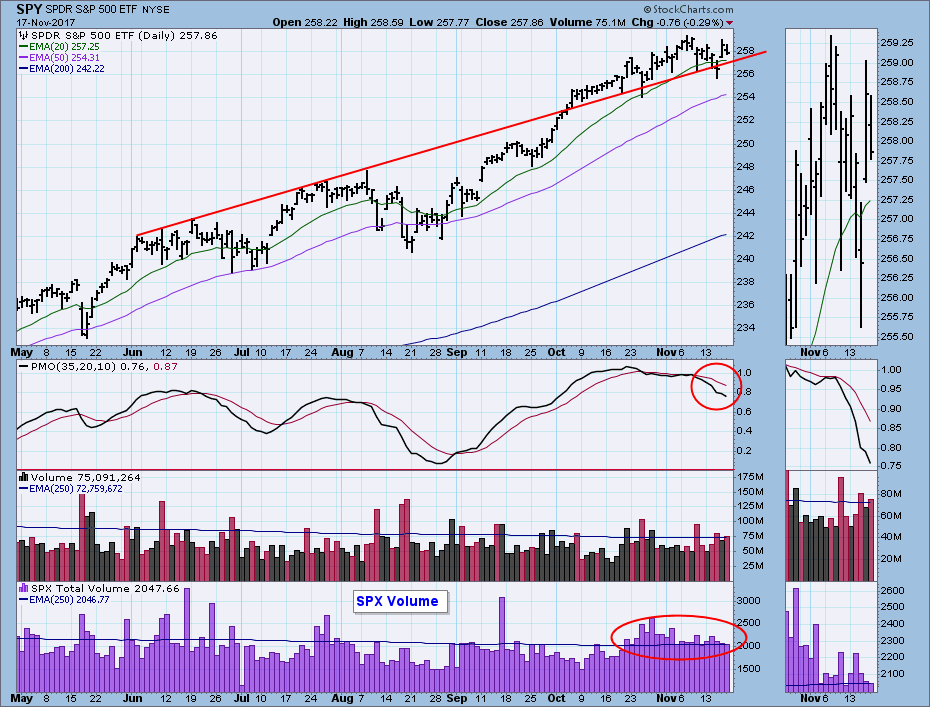
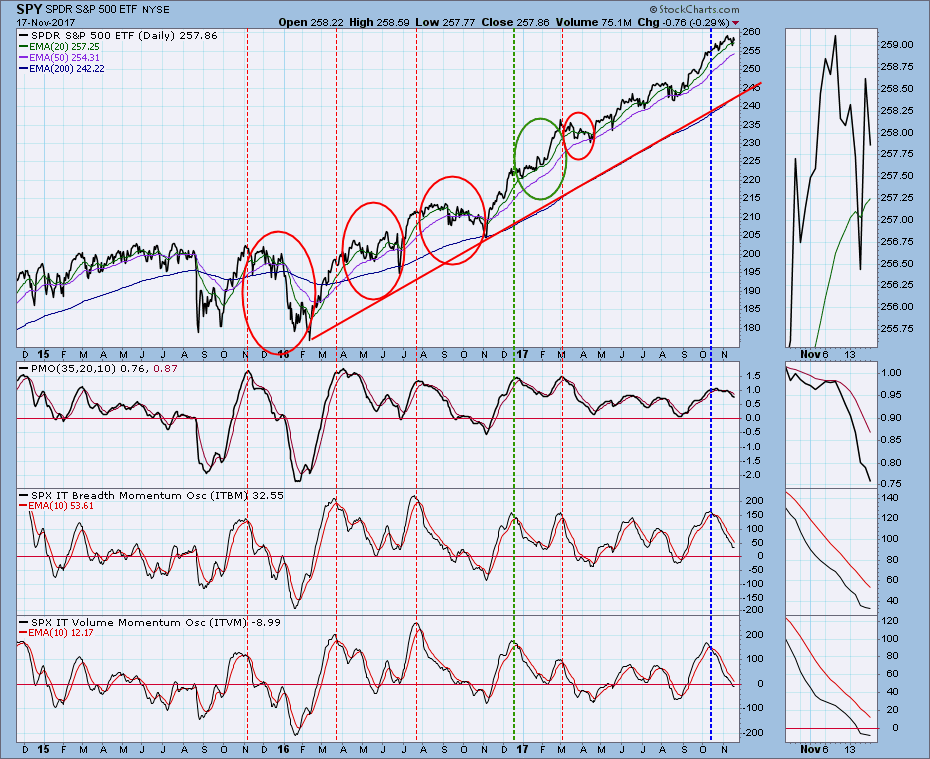
Daily Chart: On Wednesday the market completed a gut-wrenching plunge of -1.5% from last week's all-time high, but, just when we thought all was lost, buyers flooded in on Thursday pushing prices toward new, all-time highs. Seriously though, it does get a little frustrating to go this long without a serious downdraft. What stood out to me on Wednesday was that, while SPX volume was high, I thought that the price move warranted more of a volume spike. Nevertheless, SPX volume continues to be at or above the one-year average, and my opinion is that distribution is taking place. Friday was options expiration day and would account for some of the high volume on that day.
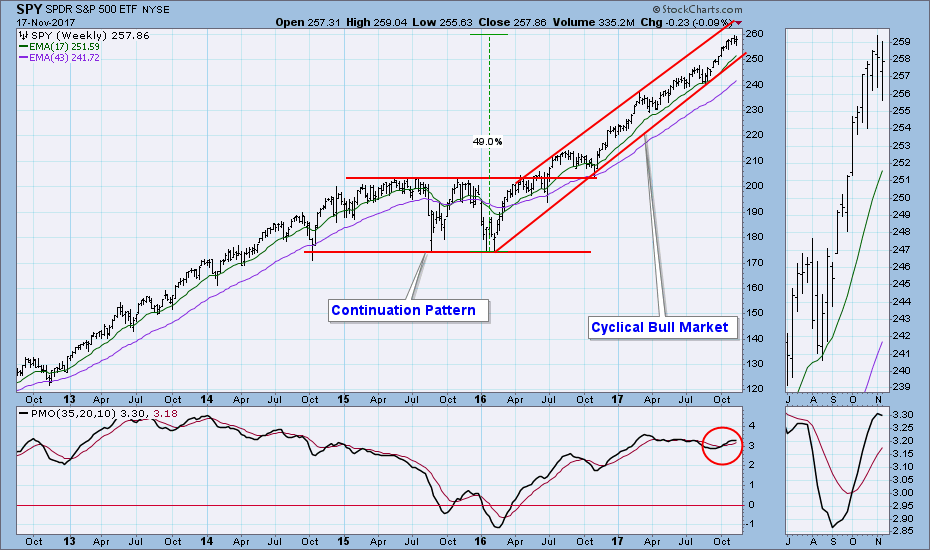
Weekly Chart: The weekly PMO topped, which typically means that a price top is near. It doesn't have to be a major top, but you can see how reliable weekly PMO tops are at predicting price tops.
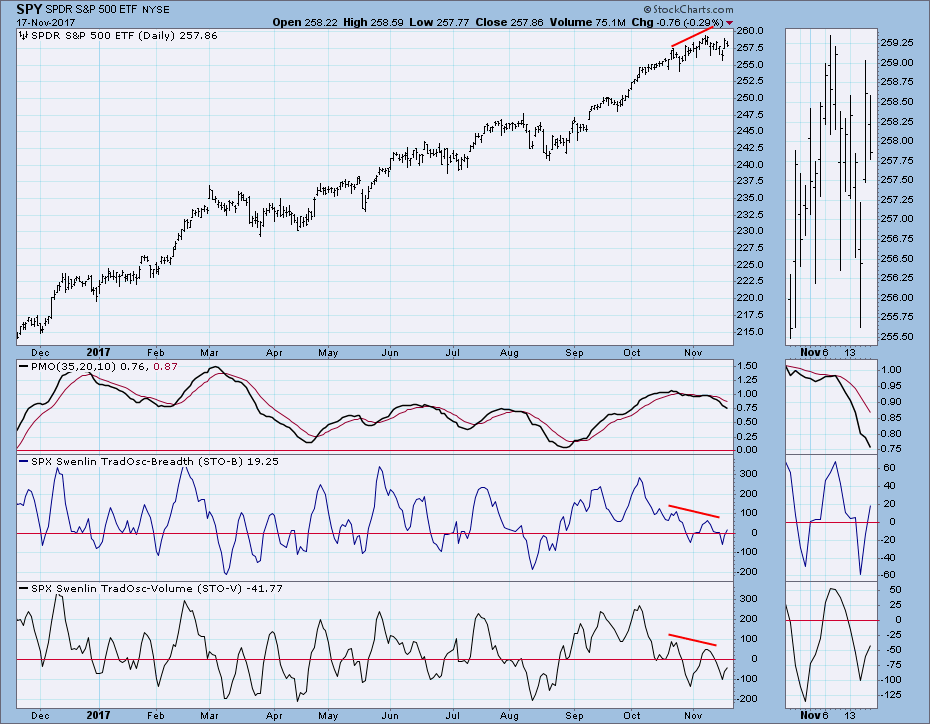
Short-Term Market Indicators: Bullish. They are oversold and rising, and they will accommodate plenty of upside.
Intermediate-Term Market Indicators: The ITBM and ITVM are getting pretty close to the level that has proven to be oversold during the last year or so. We can also see that they are decelerating, possibly in preparation for an upturn.
For What It's Worth Department: Last week I cited what I consider to be prominent bears, but this week it occurred to me that there are too many bears around. The NAAIM Exposure Index mentioned above is a good example of what I mean, but I have an even broader impression of that condition. Maybe it isn't so much that these people are bears, but rather that they are very nervous bulls.
Conclusion: The weekly PMO top concerns me, but generally, the market still refuses to show weakness beyond a minor dip. The internals will accommodate a continued rally, and sentiment has too many people looking for a top. We are in the zone for a Santa Clause rally, and my best guess is that prices will continue higher until the end of the year.
DOLLAR (UUP)
IT Trend Model: BUY as of 10/23/2017
LT Trend Model: SELL as of 5/24/2017
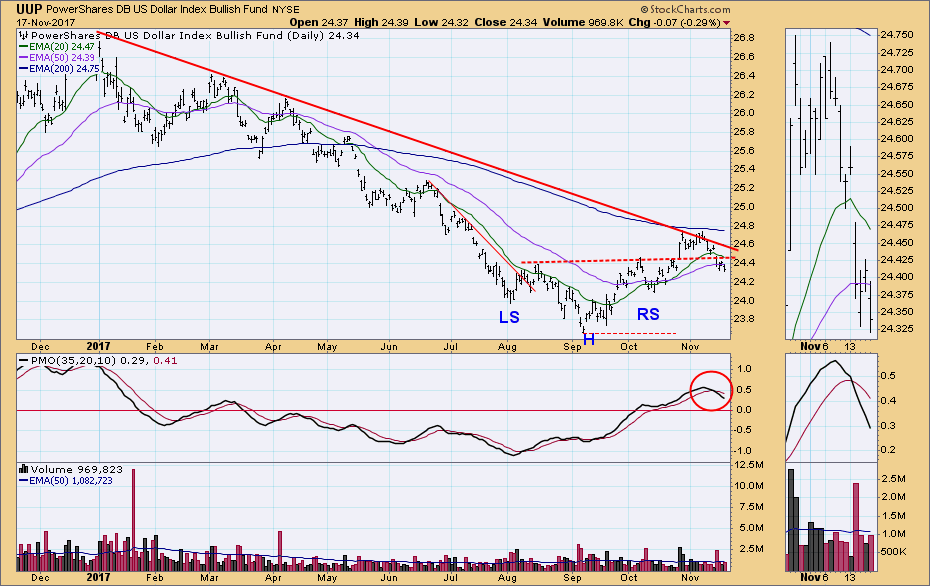
Daily Chart: UUP failed to overcome the declining tops line, and has dropped below the neckline of the reverse head and shoulders pattern. The daily PMO has topped and dropped below the signal line. Looking bearish again.
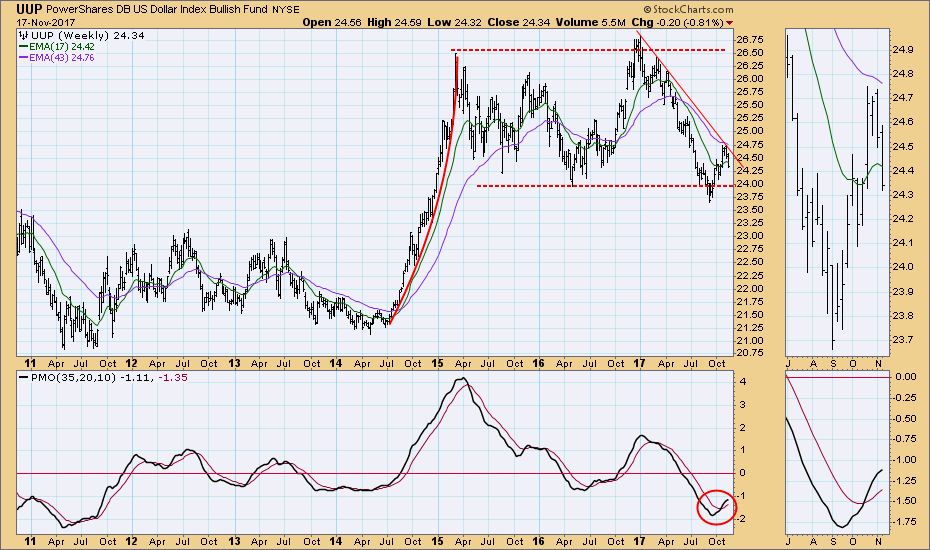
Weekly Chart: In this time frame we get a better view of UUP being turned back from the declining tops line. The weekly PMO is positive, but we can see that it is decelerating.
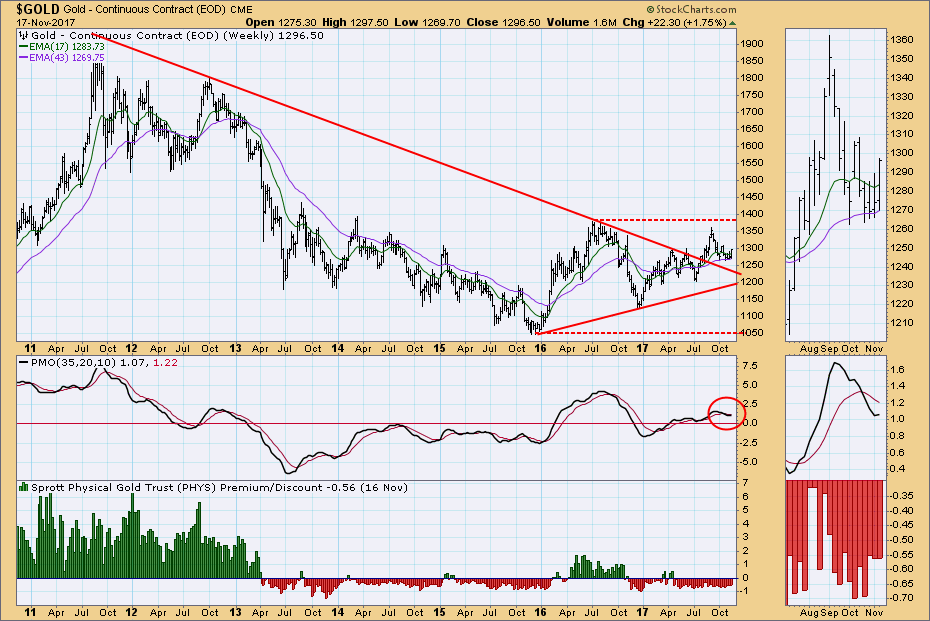
GOLD
IT Trend Model: NEUTRAL as of 10/20/2017
LT Trend Model: BUY as of 4/12/2017
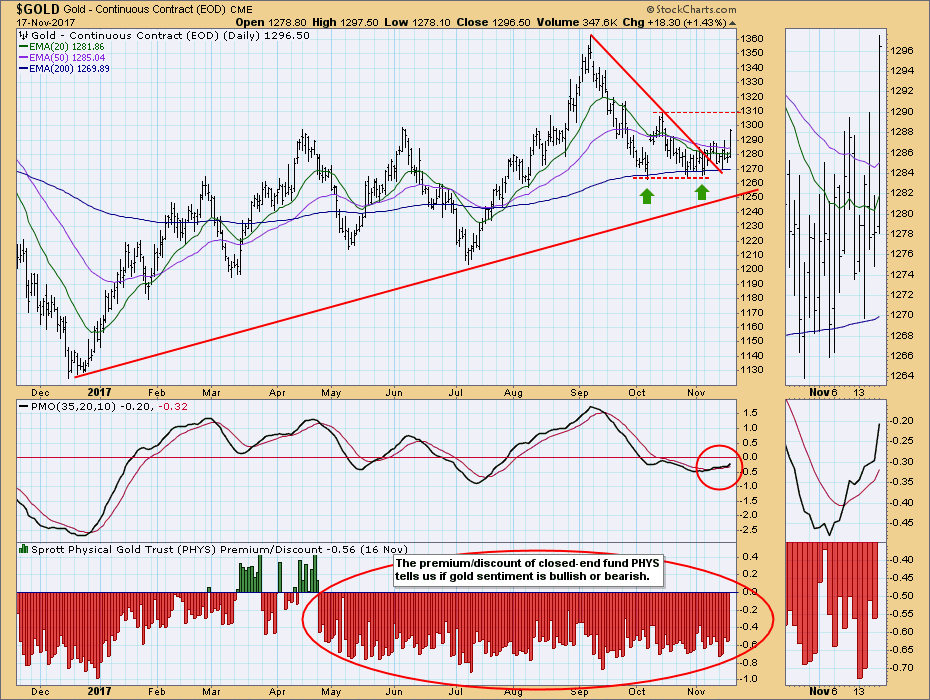
Daily Chart: Gold finally broke out of the range of the last few weeks, and the daily PMO is above the signal line and rising. Sentiment is still bearish.
Weekly Chart: Gold is bullish in this time frame, but it is still a slog. Price needs to exceed the 2016 top to establish a long-term rising trend. The weekly PMO turned up.
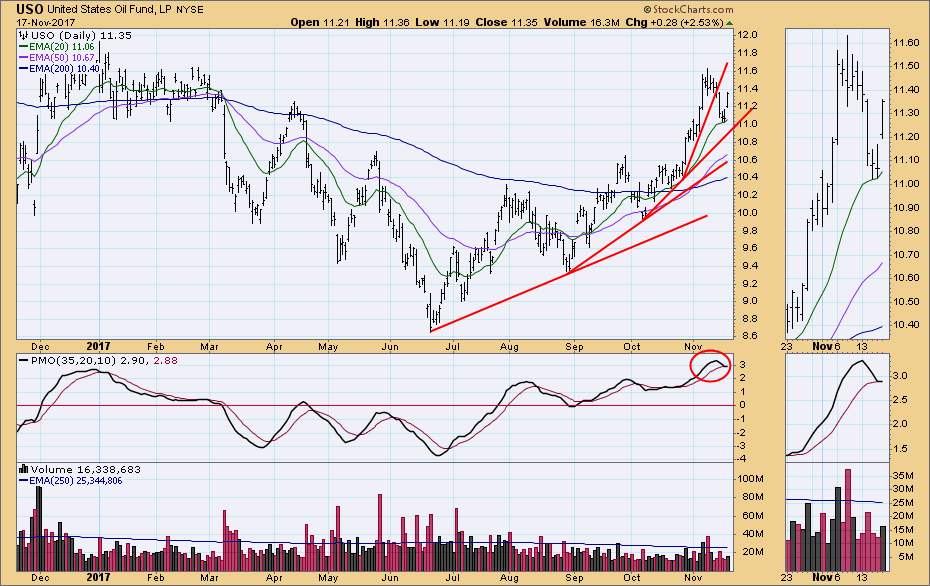
CRUDE OIL (USO)
IT Trend Model: BUY as of 9/6/2017
LT Trend Model: BUY as of 11/2/2017
Daily Chart: The ever-accelerating rising trend lines show USO in a parabolic advance from the June low. This week the steepest trend line was broken, and the daily PMO topped.
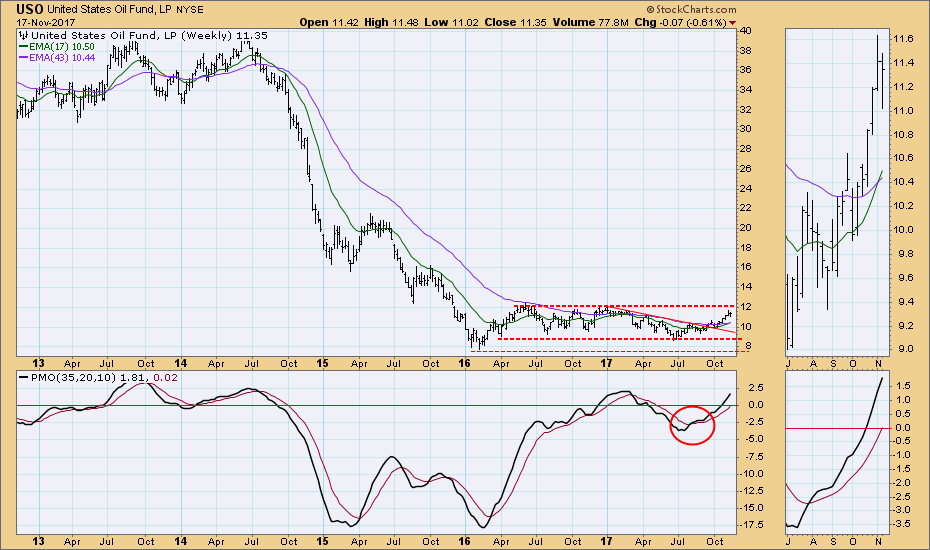
Weekly Chart: USO is approaching the top of the trading range, and the weekly PMO is near the level of the last three overbought readings.
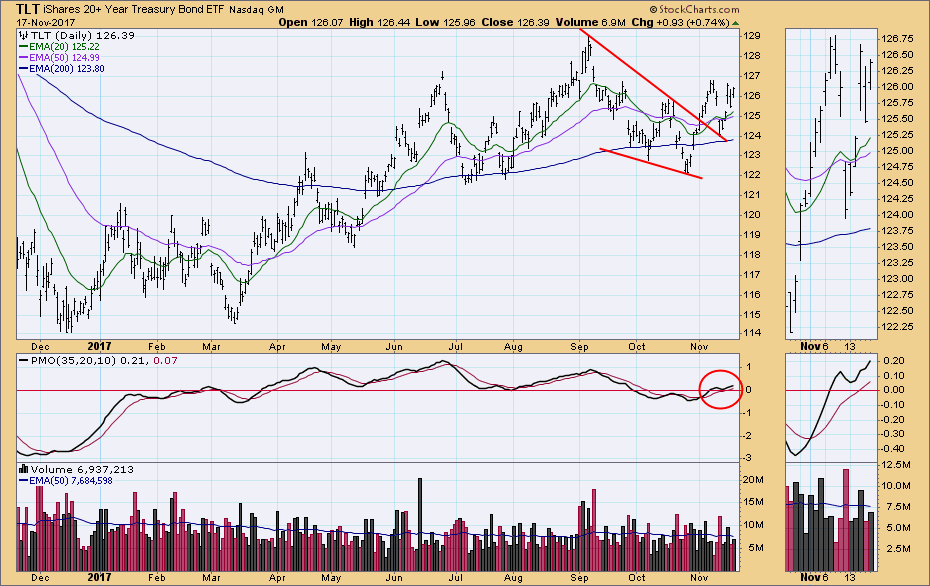
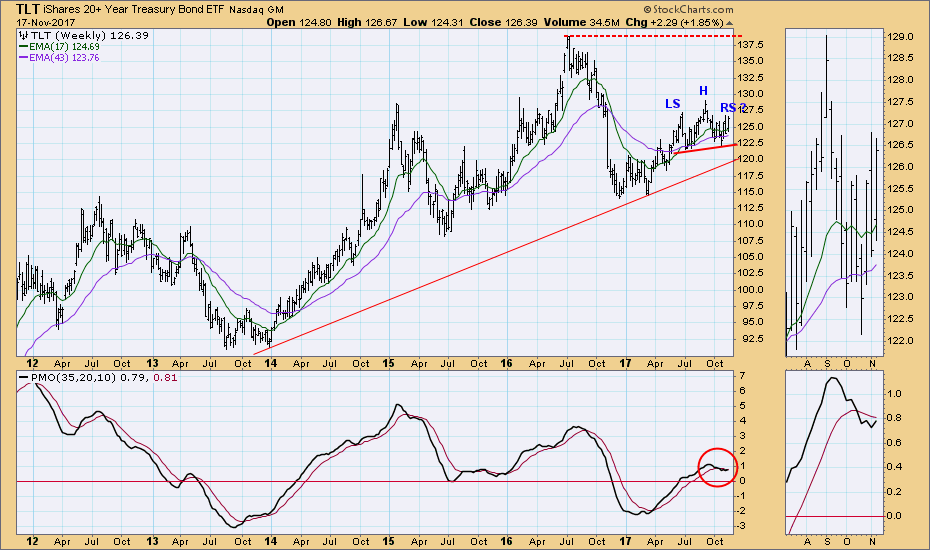
BONDS (TLT)
IT Trend Model: BUY as of 11/8/2017
LT Trend Model: BUY as of 6/16/2017
Daily Chart: TLT rallied this week, just barely missing a 20EMA/50EMA downside crossover.
Weekly Chart: The weekly PMO has turned up, but the bearish head and shoulders pattern is still an issue.
**Don't miss any of the DecisionPoint commentaries! Go to the "Notify Me" box toward the end of this blog page to be notified as soon as they are published.**
Technical Analysis is a windsock, not a crystal ball.
Happy Charting!
- Carl
NOTE: The signal status reported herein is based upon mechanical trading model signals, specifically, the DecisionPoint Trend Model. They define the implied bias of the price index based upon moving average relationships, but they do not necessarily call for a specific action. They are information flags that should prompt chart review. Further, they do not call for continuous buying or selling during the life of the signal. For example, a BUY signal will probably (but not necessarily) return the best results if action is taken soon after the signal is generated. Additional opportunities for buying may be found as price zigzags higher, but the trader must look for optimum entry points. Conversely, exit points to preserve gains (or minimize losses) may be evident before the model mechanically closes the signal.
Helpful DecisionPoint Links:
DecisionPoint Shared ChartList and DecisionPoint Chart Gallery
Price Momentum Oscillator (PMO)
Swenlin Trading Oscillators (STO-B and STO-V)

