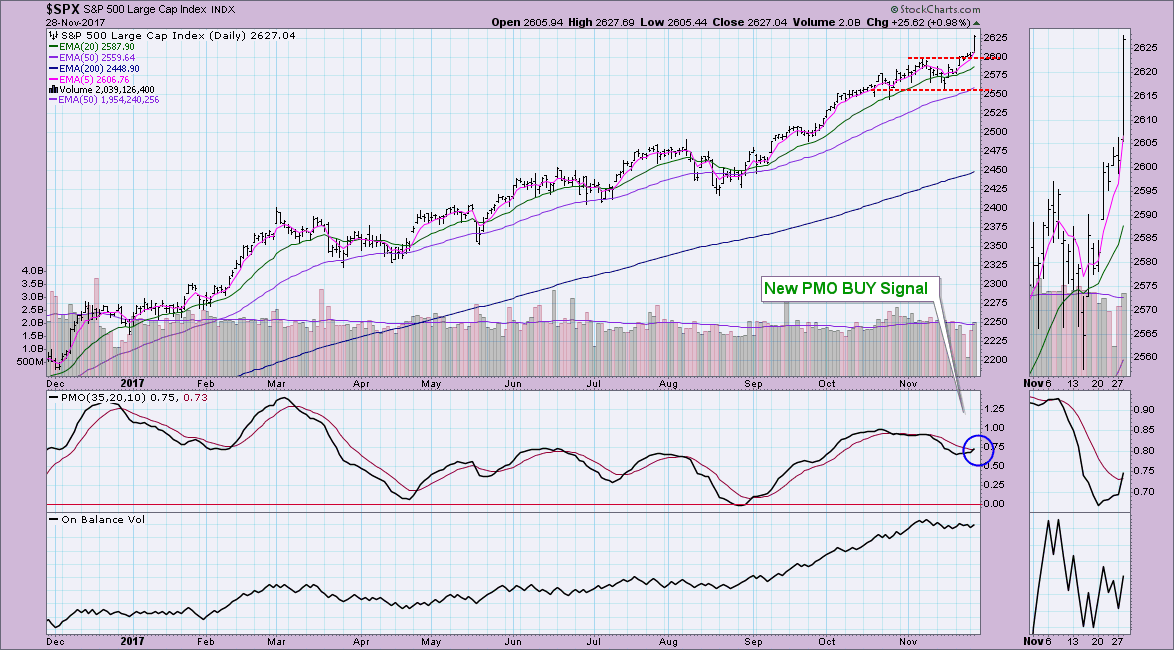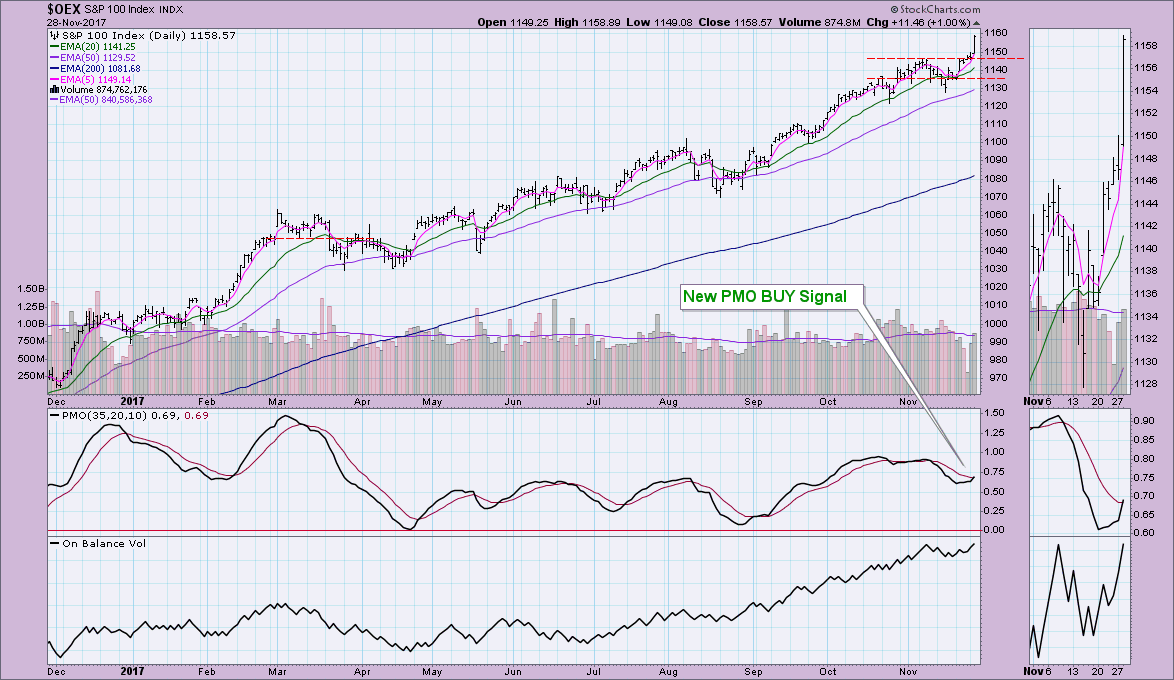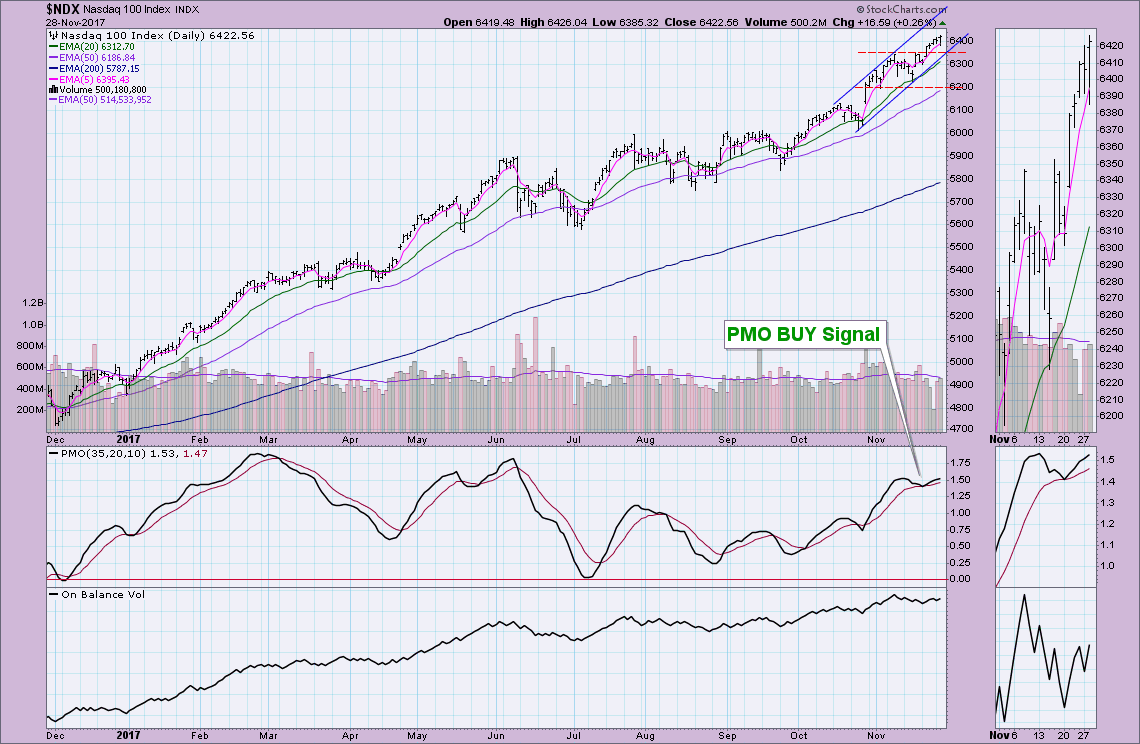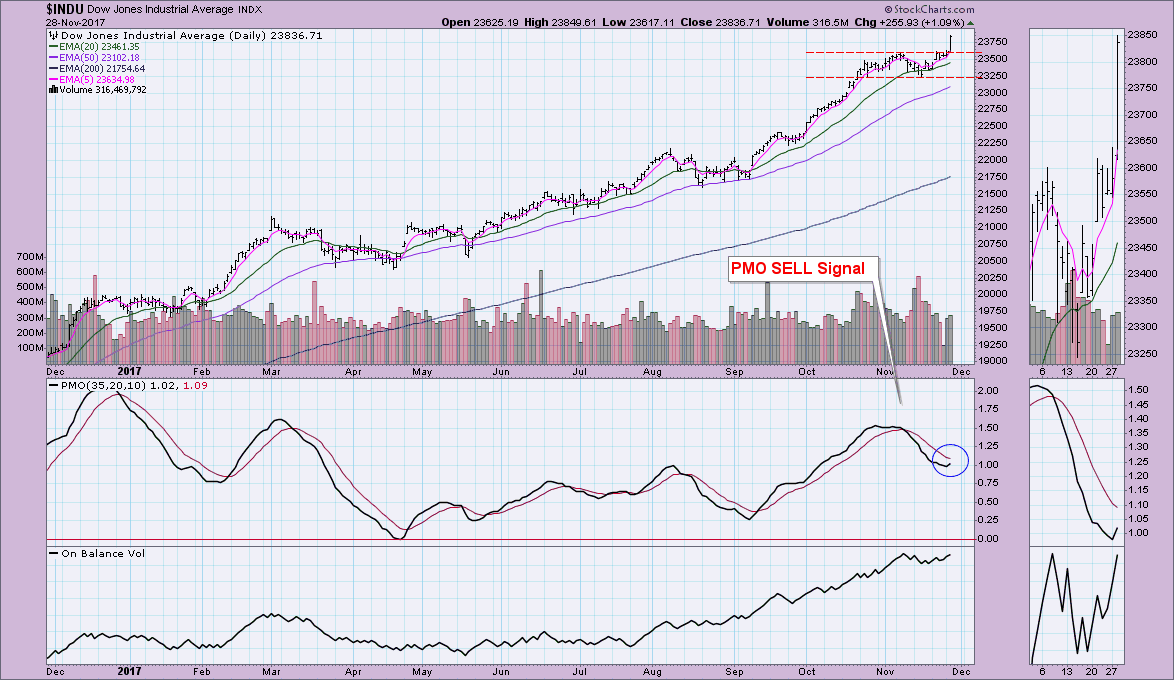
After today's rallies and big breakouts, it shouldn't surprise anyone that the OEX and SPX finally shed their PMO SELL signals. What is interesting is the Dow's 'laggard' status on triggering a PMO BUY signal. It is the last SELL signal standing. I'll give you a peek into all four charts with my DP analysis slant. Stay tuned tomorrow for a "DP Alert" article where I'll review all of the indicators, as well as the "big four"--Dollar, Oil, Gold and Bonds.
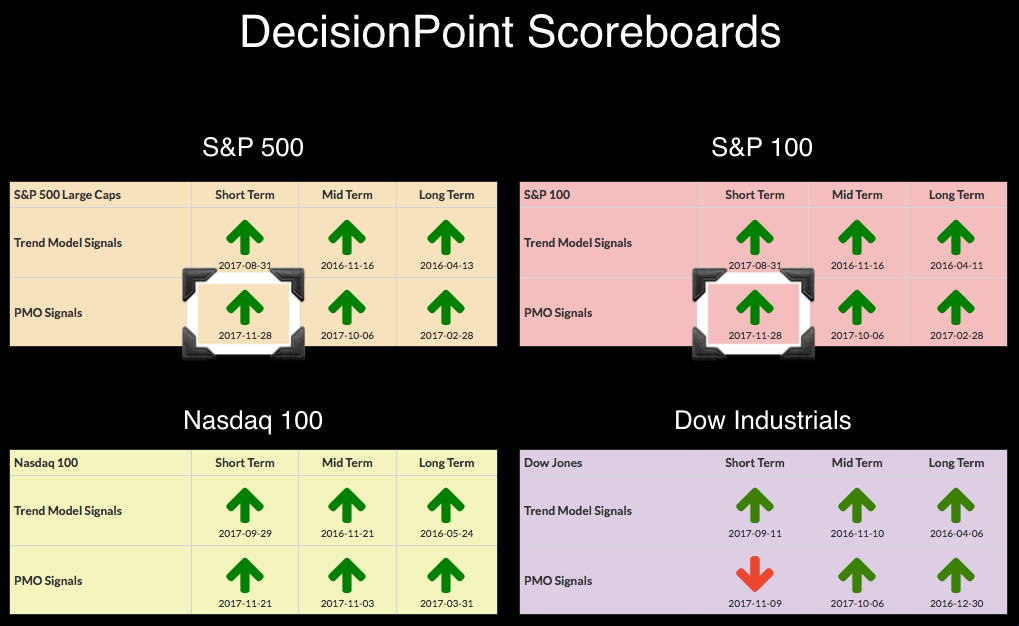
You'll note on all but the NDX chart, a clear consolidation zone that performed well to unwind the PMO without too much degradation to price. Now they have turned up and in the case of the OEX and SPX, logged new PMO BUY signals.
Today's breakout to new all-time highs on the SPX was impressive. The PMO was yanked higher today and that is what triggered the BUY signal. I really like that the PMO is not overbought. Despite the consolidation of November up until now, the PMO didn't lose too much ground and I find that positive. The OBV shows no deterioration of volume as it travels sideways. I would be looking at today's move as an initiation. We will likely see the rally continue higher.
The picture is about the same on the OEX, so my comments on the SPX can be applied here.
The NDX has a slightly different feel. While we did see some consolidation going into November, the rally touched off a bit sooner for techs and the steep rising trend channel remained intact. We did get some whipsaw on the last PMO BUY signal. Look at the beautiful rise of PMO tops and bottoms and their match to price tops and bottoms. This is a bullish confirmation of the current rally. If we see the PMO top here, that would be a negative divergence between price tops and PMO tops. We're not there yet and I suspect with the rally continuing, the PMO will rise above its previous top.
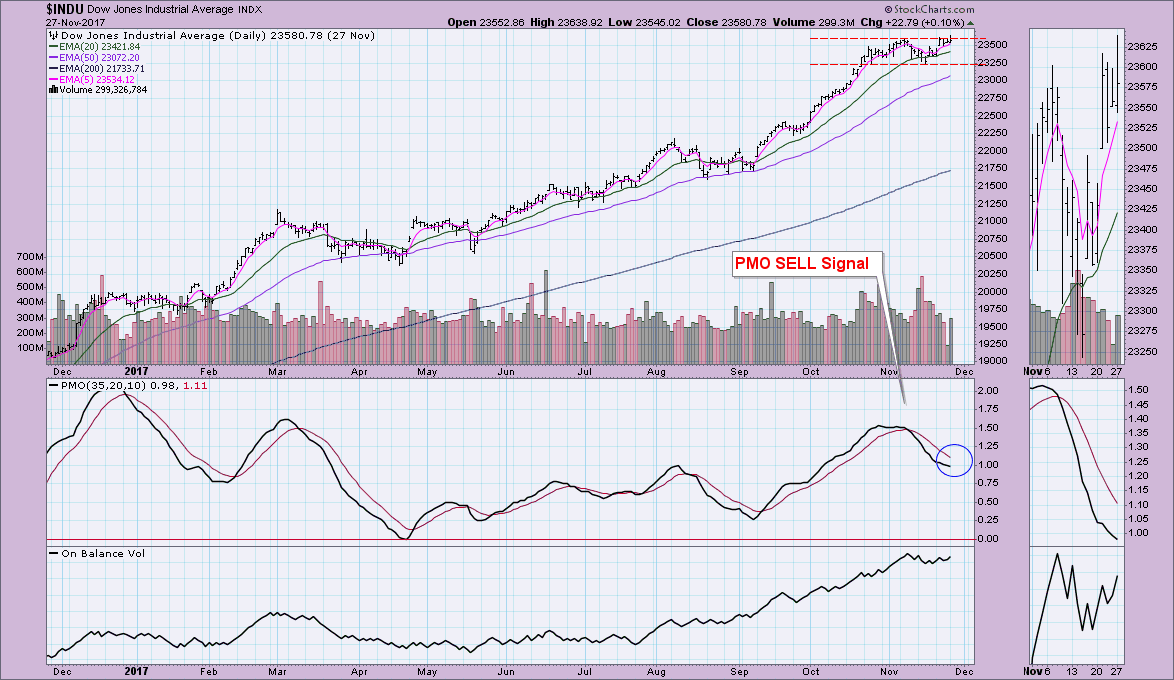
The Dow is finally seeing its PMO rising. A peek at yesterday's chart (2nd chart below) shows the PMO had still not bottomed. I'd honestly been looking at a possible head and shoulders formation within that trading channel. Of course that has flown the coop. I was telling my viewers today during MarketWatchers LIVE that in a bull market, use bull market rules. The simple instruction is not to expect bearish outcomes in a bull market. Expecting a bearish head and shoulders pattern to activate during a strong bull market isn't part of those rules; however, price eventually does break down so ignoring the possibility of a bearish outcome isn't wise either. As I noted earlier, we are in the midst of a strong bull market and I see today's breakouts as initiation climaxes or an initiation to higher prices.
Helpful DecisionPoint Links:
DecisionPoint Shared ChartList and DecisionPoint Chart Gallery
Price Momentum Oscillator (PMO)
Swenlin Trading Oscillators (STO-B and STO-V)
Technical Analysis is a windsock, not a crystal ball.
Happy Charting!
- Erin
**Don't miss DecisionPoint Commentary! Add your email below to be notified of new updates"**

