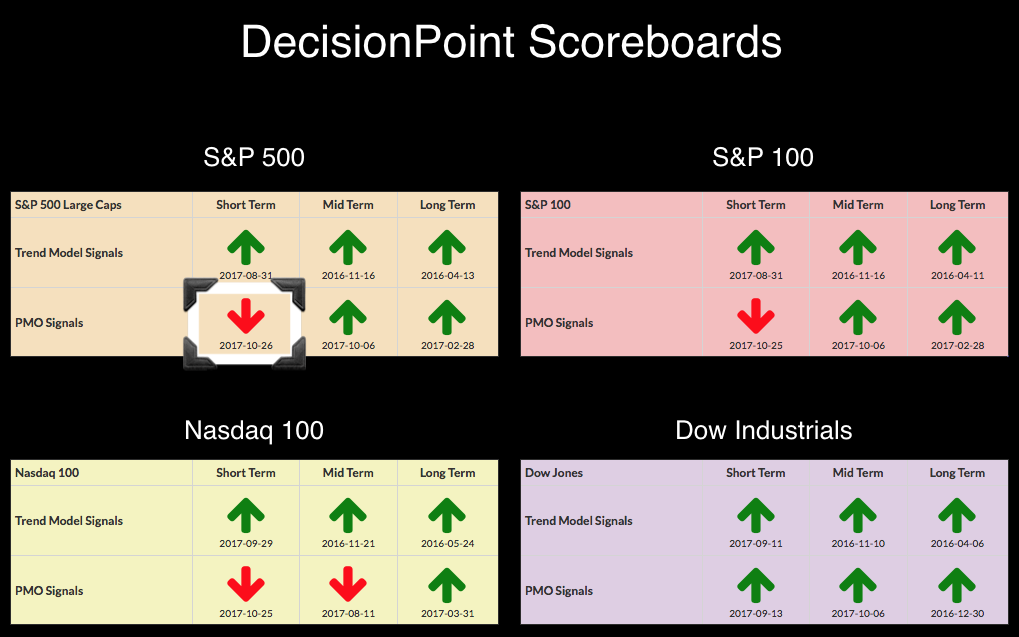
I updated the DecisionPoint Scoreboards yet again today. Yesterday saw the new PMO SELL signals on the NDX and OEX and today the SPX has followed suit by generating its own PMO SELL signal. You'll note that "one of these things is not like the others" on the Scoreboards as far as the short-term PMO. The Dow Industrials ($INDU) has been the titan of indexes with very little holding it back. Below is a tale of two very different charts.

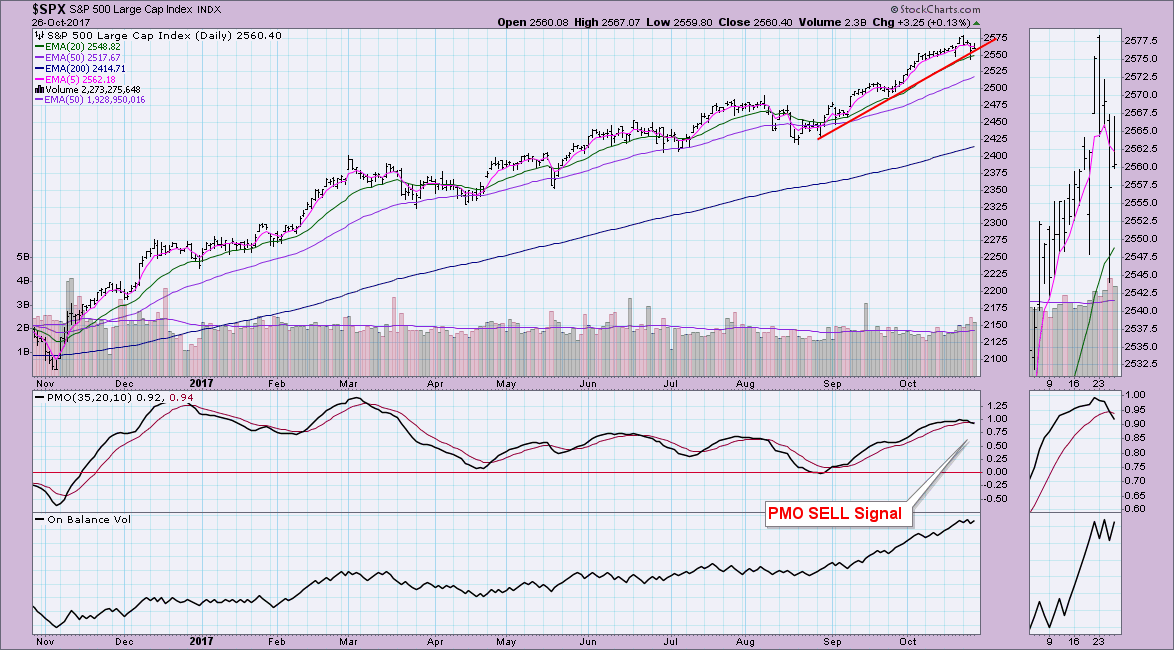
The SPX has dipped this week and yesterday, it nearly closed below rising bottoms line support and the 20-EMA. It wasn't a good feeling seeing it drop so low intraday. Today the market traded above yesterday's close the entire day which is positive, but the falling PMO and new PMO SELL signal is cautionary. The OBV is moving sideways so there isn't much deterioration of that indicator. Support along the rising bottoms line held today, which is bullish. I'm thinking we should expect this rising bottoms trendline to start flattening out more with some more decline. This will give the PMO an opportunity to move out of overbought territory and establish a rising bottoms trendline that will be easier to maintain.
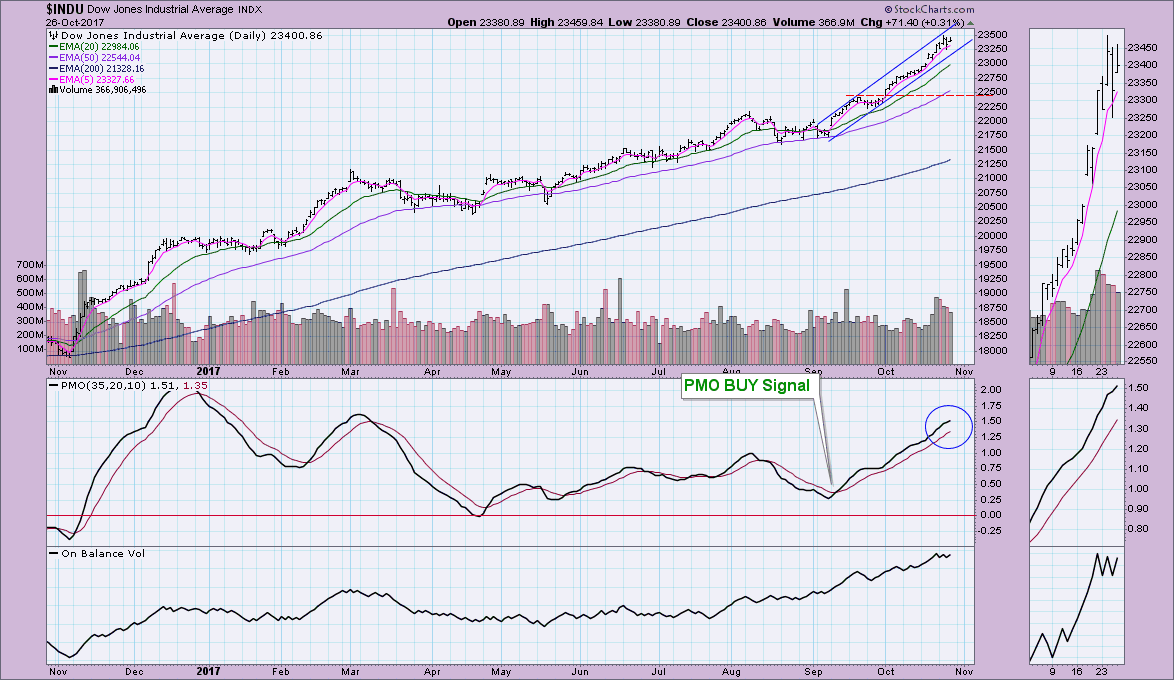
Look at the chart of the Dow... totally different "feel" (my California accent written out lol, totally)! The Dow is easily maintaining a steep rising trend channel. It isn't even that close to testing the bottom of the channel! The PMO has yet to turn down. The PMO is not completely overbought here either. If the Dow continues to hold this internal strength, the other indexes will be lifted up or at least given a life preserver to keep them from sinking.
Conclusion: It's hard to get bearish in this bull market, but we are seeing some problems with momentum on all but the Dow. If the Dow takes a turn for the worse, I think that will trigger a big decline. At this point, with it holding onto its strength, I'm expecting to see the SPX resume its rally after pulling back just a hair more.
Helpful DecisionPoint Links:
DecisionPoint Shared ChartList and DecisionPoint Chart Gallery
Price Momentum Oscillator (PMO)
Swenlin Trading Oscillators (STO-B and STO-V)
Technical Analysis is a windsock, not a crystal ball.
Happy Charting!
- Erin
**Don't miss DecisionPoint Commentary! Add your email below to be notified of new updates"**


