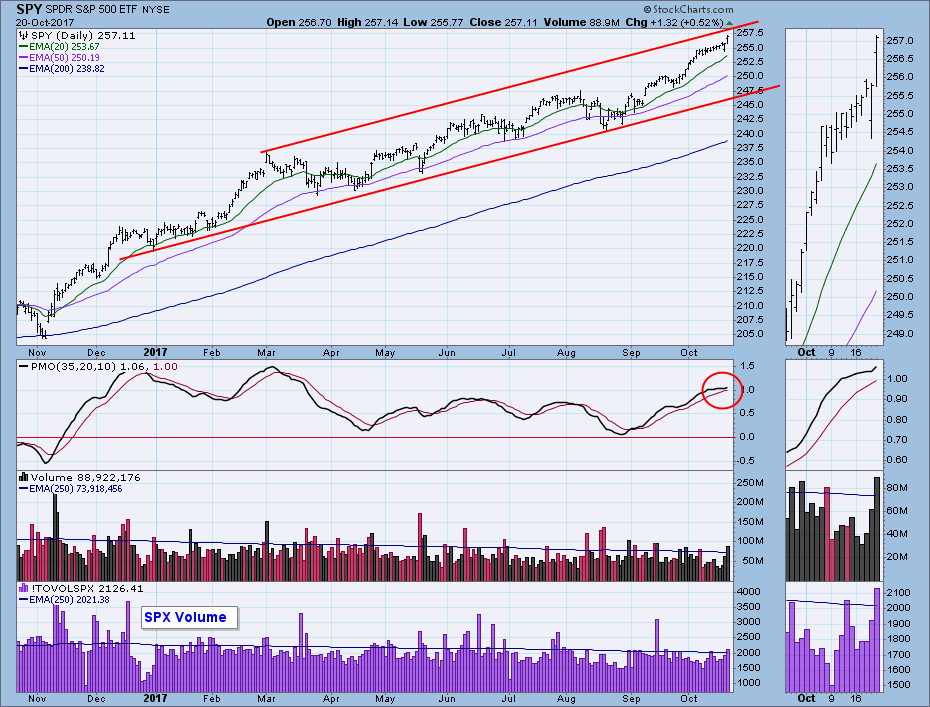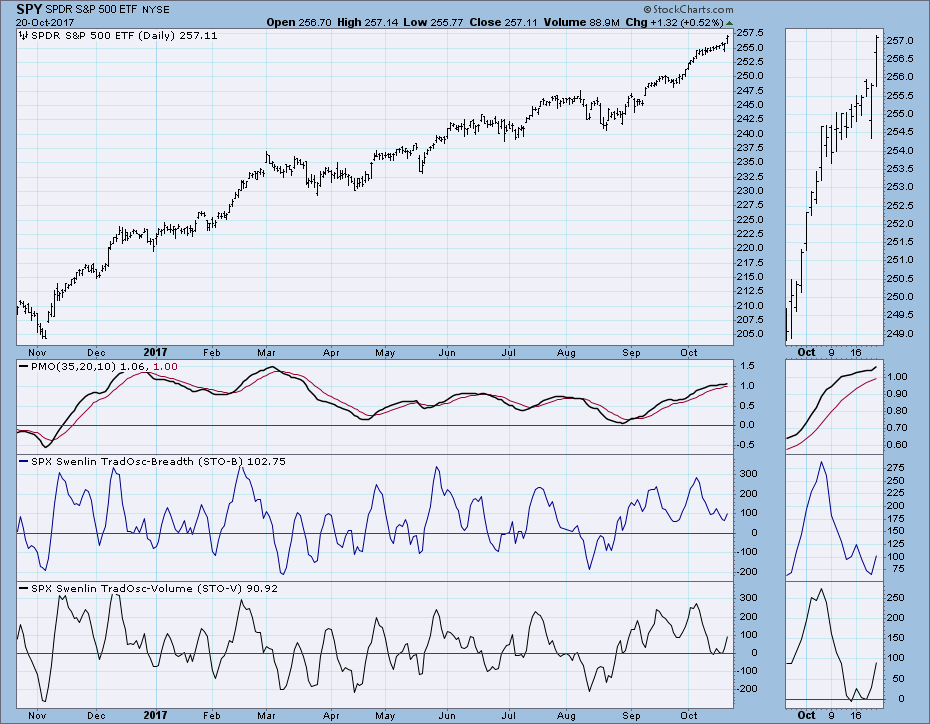
Back in September the market had a small pullback that took all of three days (blue circle on chart below). This week I was expecting at least something similar, but all that happened was an intraday dip on Thursday that disappeared by the time the market closed! Then on Friday the market gapped up to new, all-time highs.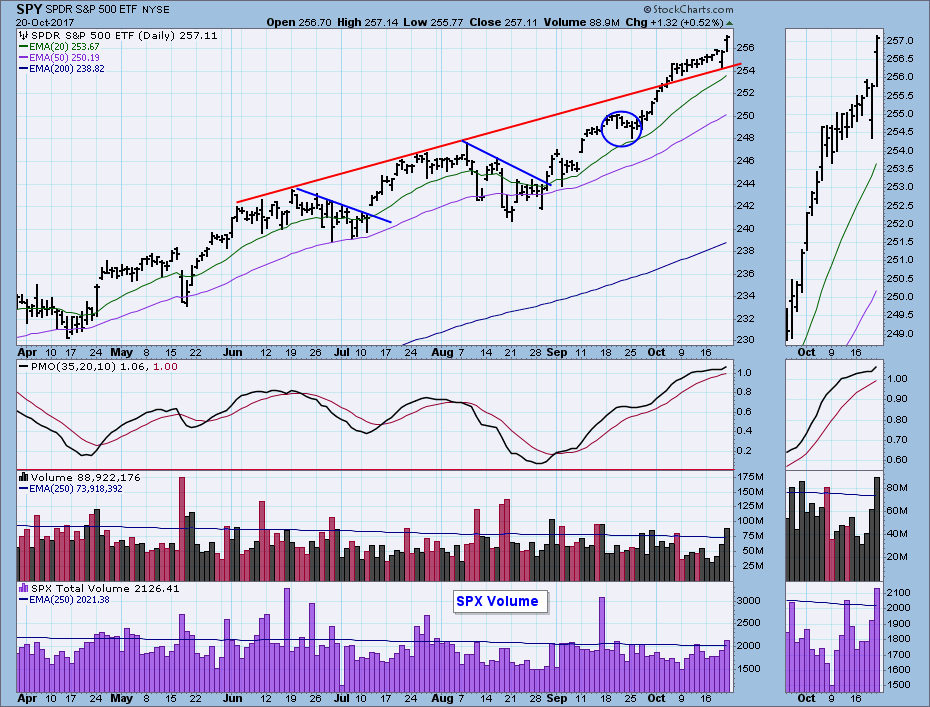
The DecisionPoint Weekly Wrap presents an end-of-week assessment of the trend and condition of the stock market (S&P 500), the U.S. Dollar, Gold, Crude Oil, and Bonds.
STOCKS
IT Trend Model: BUY as of 11/15/2016
LT Trend Model: BUY as of 4/1/2016
Daily Chart: I have made some changes on this chart, primarily drawing a rising trend line below the most recent 10 months of price bars, then drawing a line parallel to the trend line, anchored on the March high. This defines a theoretical channel that could limit the current rally. Frankly, I think that is kind of lame, but it is the best I could come up with in this time frame. Options expiration was on Friday, so that will explain the high volume.
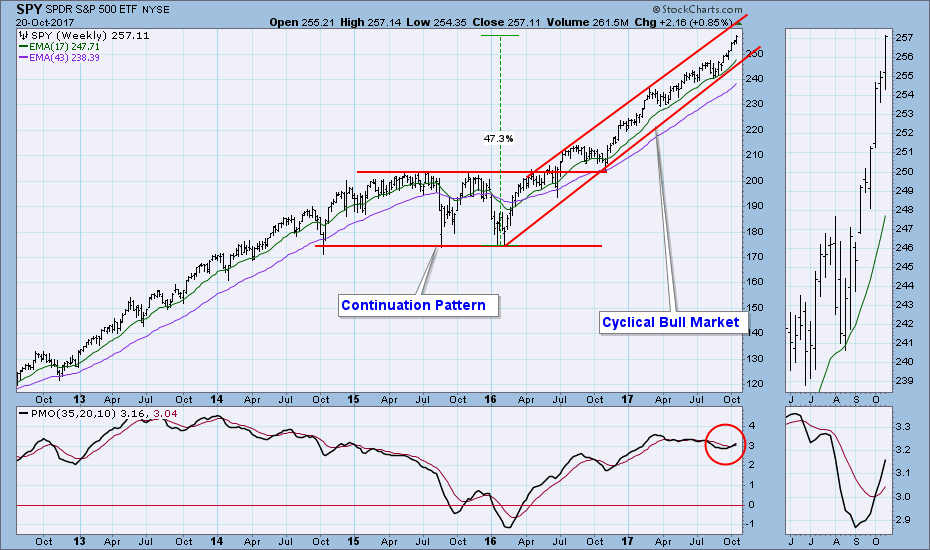
Weekly Chart: This chart demonstrates why it is always good to step back in favor of getting a broader view. The top of the cyclical bull market rising trend channel shows a logical upside limit to the current rally. Price may not make it that far, or it may blast through the resistance, but at least we have a logical target for a market that has no horizontal resistance ahead at all.
Short-Term Market Indicators: Basically neutral and headed in a bullish direction.
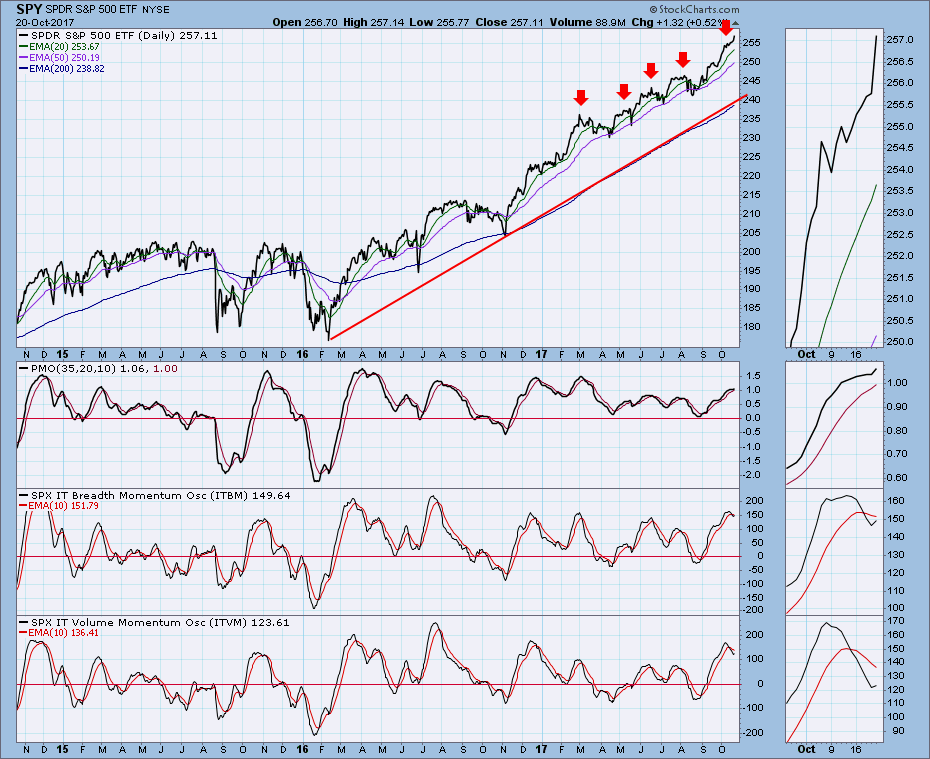
Intermediate-Term Market Indicators: The indicators are overbought, and, until Friday, they were falling. Now that they have turned up, maybe they will get even more overbought. Typically when the intermediate-term indicators turn down, price will also top and correct in some way. But sometimes it takes up to a month before price succumbs to the weakening internals. The ITBM and ITVM topped two weeks ago.
Conclusion: The market is overbought and well above the cyclical bull market rising trend line. To me that makes the market vulnerable for a correction. There has not been a serious correction since the election, and I'm not looking for that to change in the near future. It is not an ideal time to be opening new long positions, but it isn't time to exit either.
DOLLAR (UUP)
IT Trend Model: NEUTRAL as of 3/21/2017
LT Trend Model: SELL as of 5/24/2017
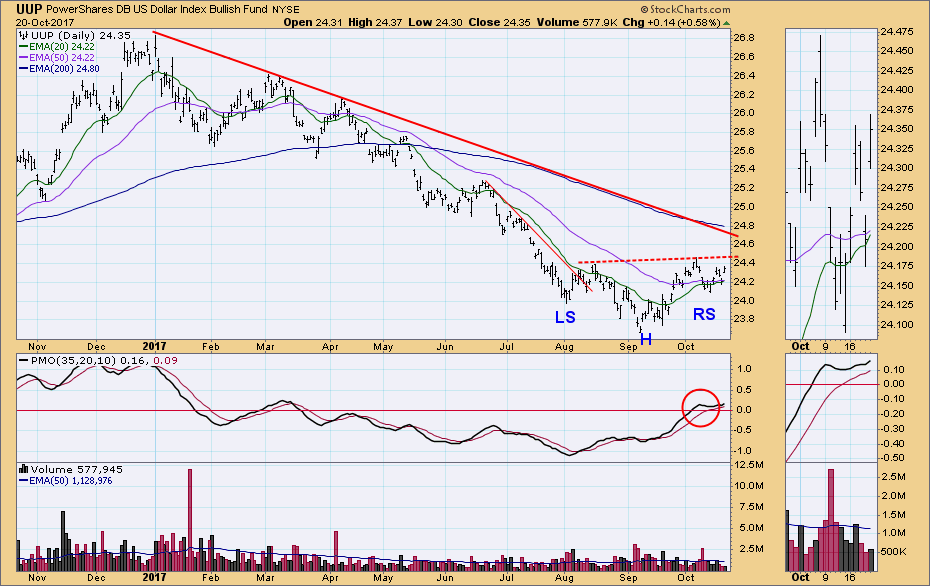
Daily Chart: I think we can safely say that the right shoulder has formed on the reverse head and shoulders pattern I have noted. The pattern will execute (initiate expectations of higher prices) if price crosses up through the neckline. At that point, the minimum upside target will be 25.30. Another positive sign is that the PMO has turned up above the signal line.
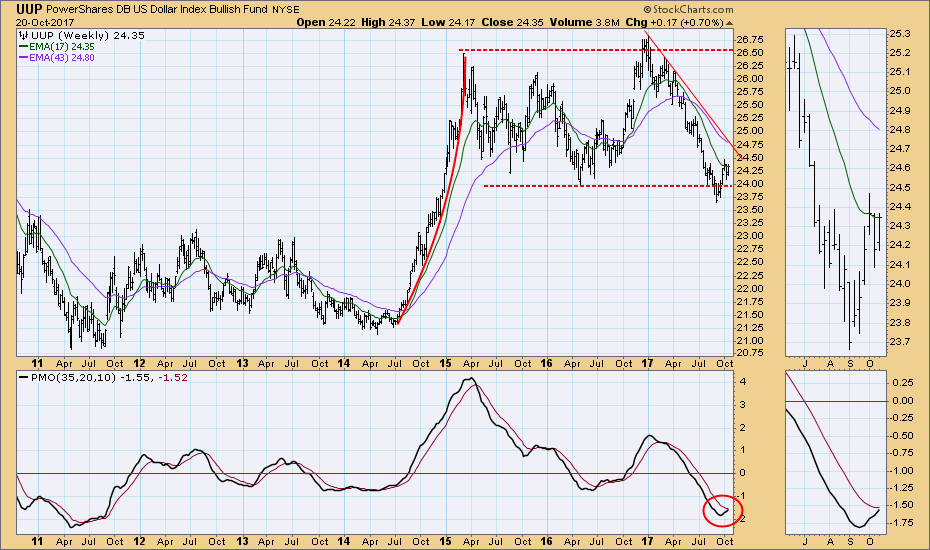
Weekly Chart: The PMO is rising, and price won't hit resistance until it reaches the declining tops line drawn from the January top.
GOLD
IT Trend Model: NEUTRAL as of 10/20/2017
LT Trend Model: BUY as of 4/12/2017
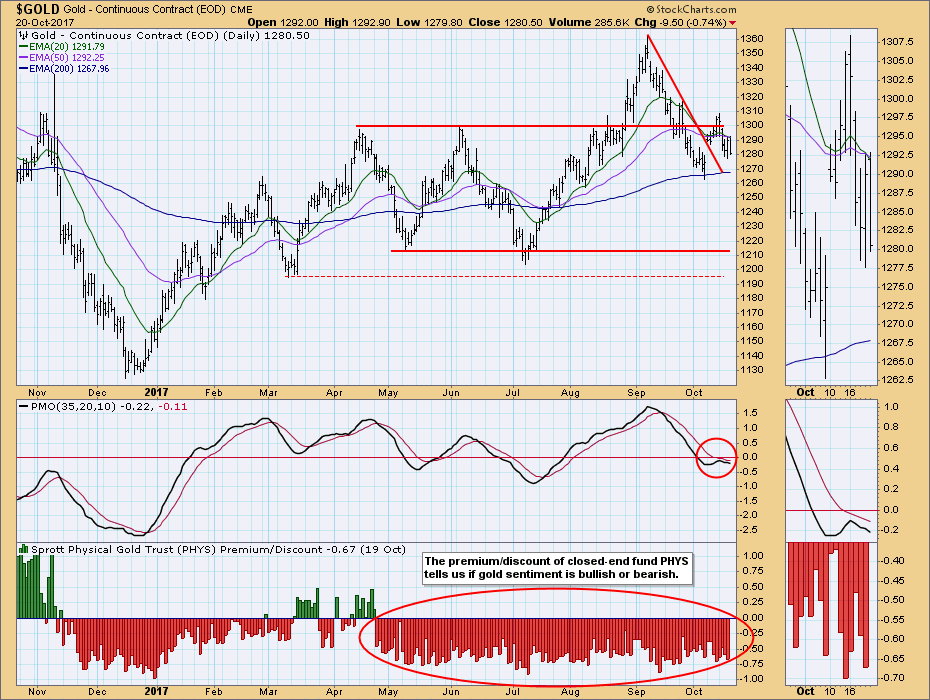
Daily Chart: Last week gold's BUY signal was barely saved by a rally above the 20EMA, but this week's price decline caused the 20EMA to cross down through the 50EMA. Since the 50EMA is above the 200EMA, the IT Trend Model signal changes from BUY to NEUTRAL, not SELL. The PMO topped below the signal line, which is a bad omen. Since the dollar is looking more bullish, it is likely that gold will struggle at best.
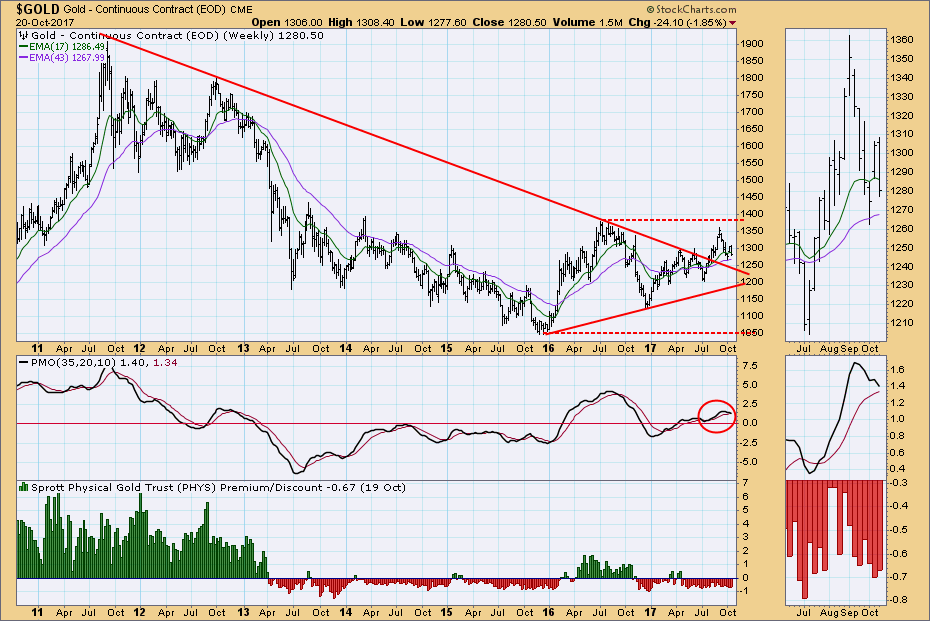
Weekly Chart: The weekly PMO has topped, but price remains above the long-term declining tops line. Price looks marginally positive, but lacks kind of energy seen in the 2016 rally.
CRUDE OIL (USO)
IT Trend Model: BUY as of 9/6/2017
LT Trend Model: SELL as of 3/9/2017
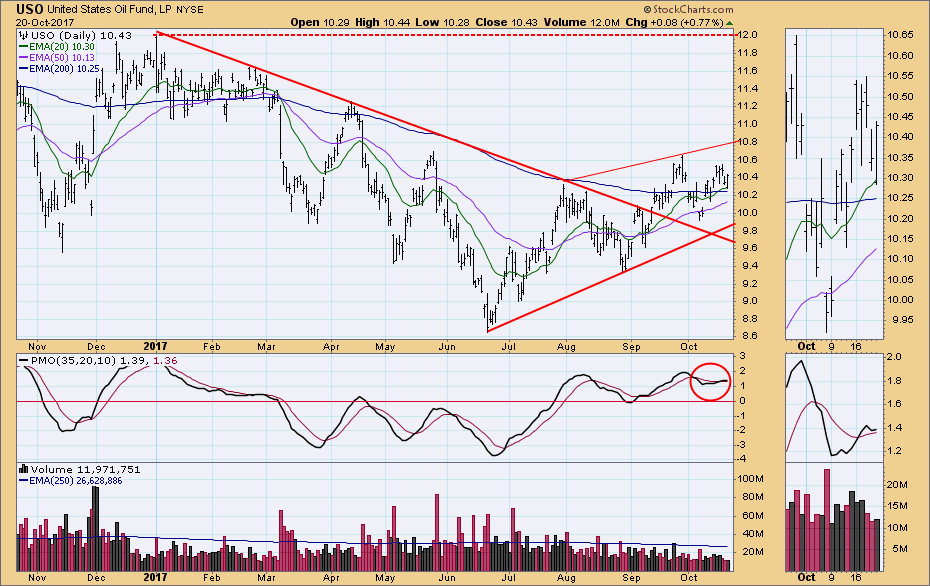
Daily Chart: USO price appears to be stalling, and the PMO has topped. Nevertheless, the chart is mostly bullish, the PMO being the exception.
Weekly Chart: USO remains above the declining tops line, and the weekly PMO is rising. I see the top of the trading channel as being the upside limit of the rally.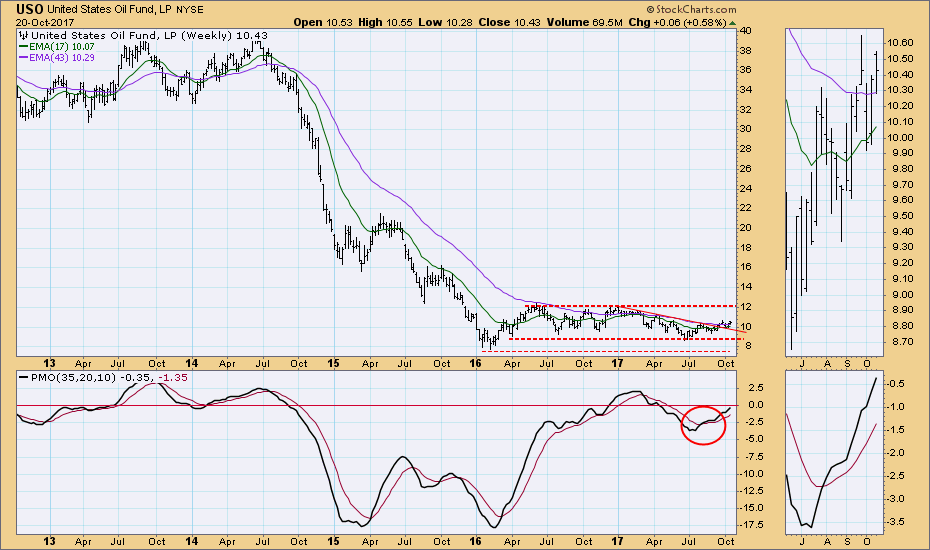
BONDS (TLT)
IT Trend Model: NEUTRAL as of 10/5/2017
LT Trend Model: BUY as of 6/16/2017
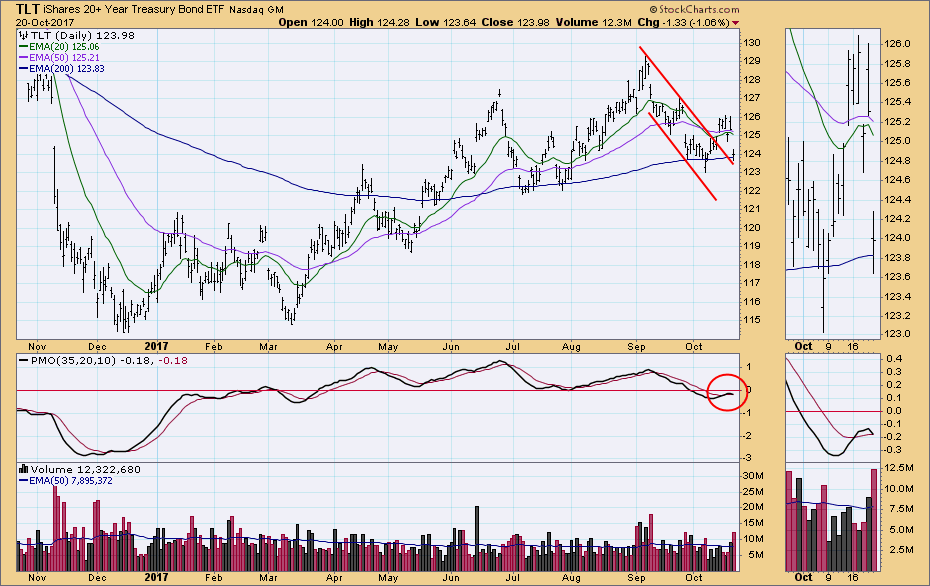
Daily Chart: It looked as if a new rally was beginning when TLT broke out of a declining trend channel this week, but on Friday price reversed. This caused the 20EMA to top below the 50EMA, which is negative. The PMO also topped and is about to cross down through the signal line.
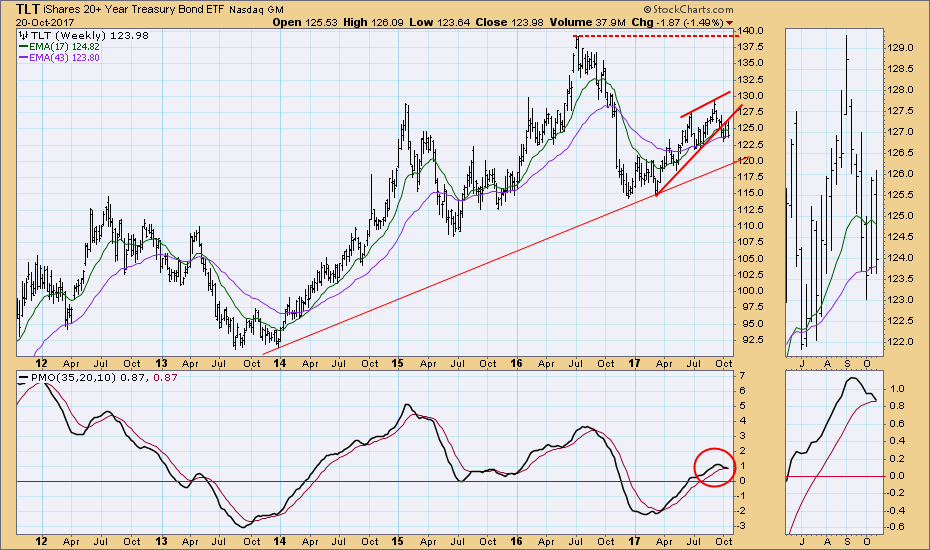
Weekly Chart: After breaking down from a rising wedge formation, TLT rallied back to the point of breakdown. The weekly PMO has topped and is about to cross down through the signal line.
**Don't miss any of the DecisionPoint commentaries! Go to the "Notify Me" box toward the end of this blog page to be notified as soon as they are published.**
Technical Analysis is a windsock, not a crystal ball.
Happy Charting!
- Carl
NOTE: The signal status reported herein is based upon mechanical trading model signals, specifically, the DecisionPoint Trend Model. They define the implied bias of the price index based upon moving average relationships, but they do not necessarily call for a specific action. They are information flags that should prompt chart review. Further, they do not call for continuous buying or selling during the life of the signal. For example, a BUY signal will probably (but not necessarily) return the best results if action is taken soon after the signal is generated. Additional opportunities for buying may be found as price zigzags higher, but the trader must look for optimum entry points. Conversely, exit points to preserve gains (or minimize losses) may be evident before the model mechanically closes the signal.
Helpful DecisionPoint Links:
DecisionPoint Shared ChartList and DecisionPoint Chart Gallery
Price Momentum Oscillator (PMO)
Swenlin Trading Oscillators (STO-B and STO-V)

