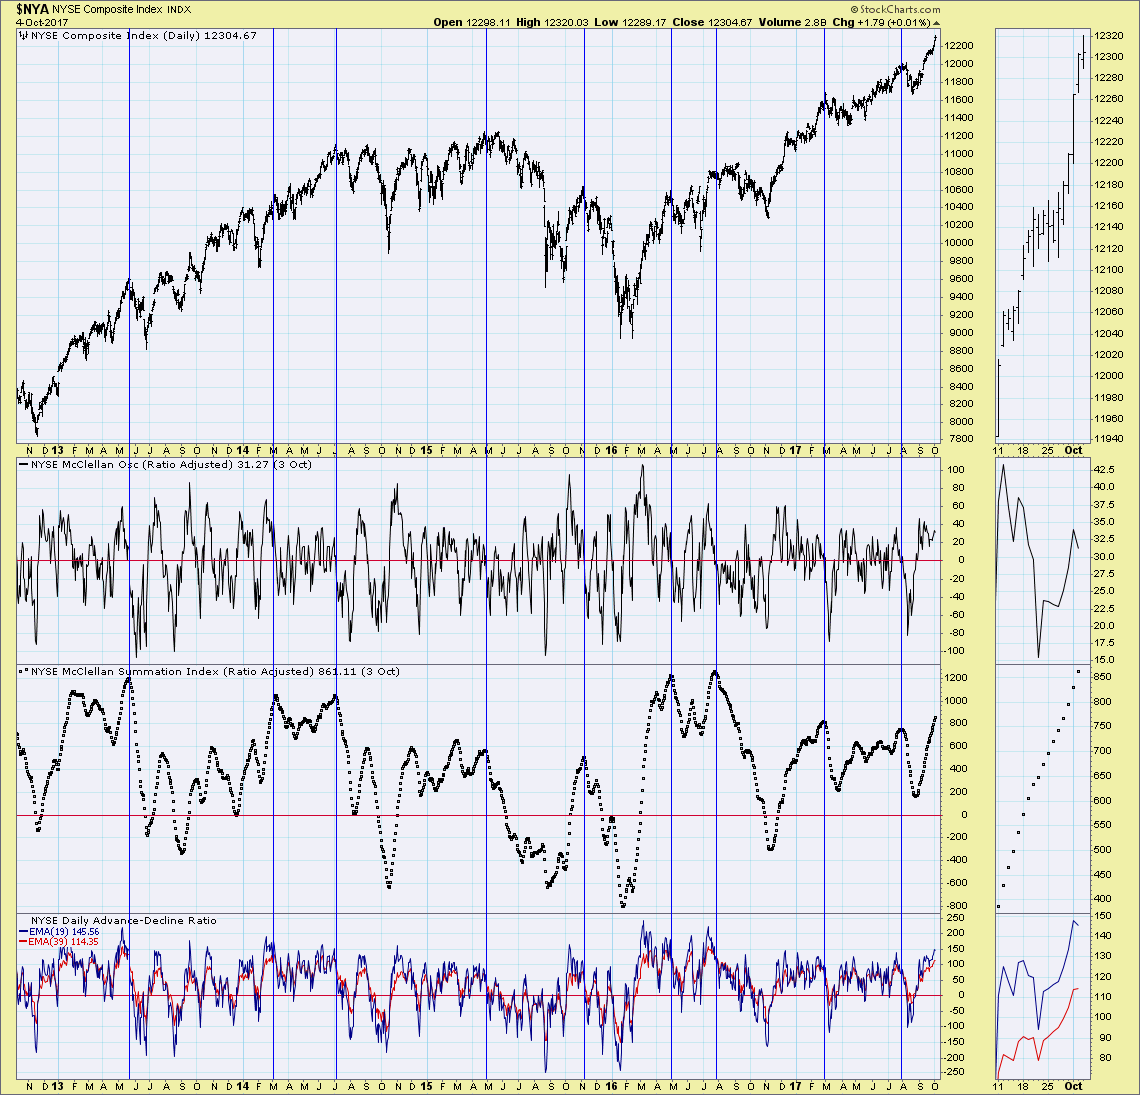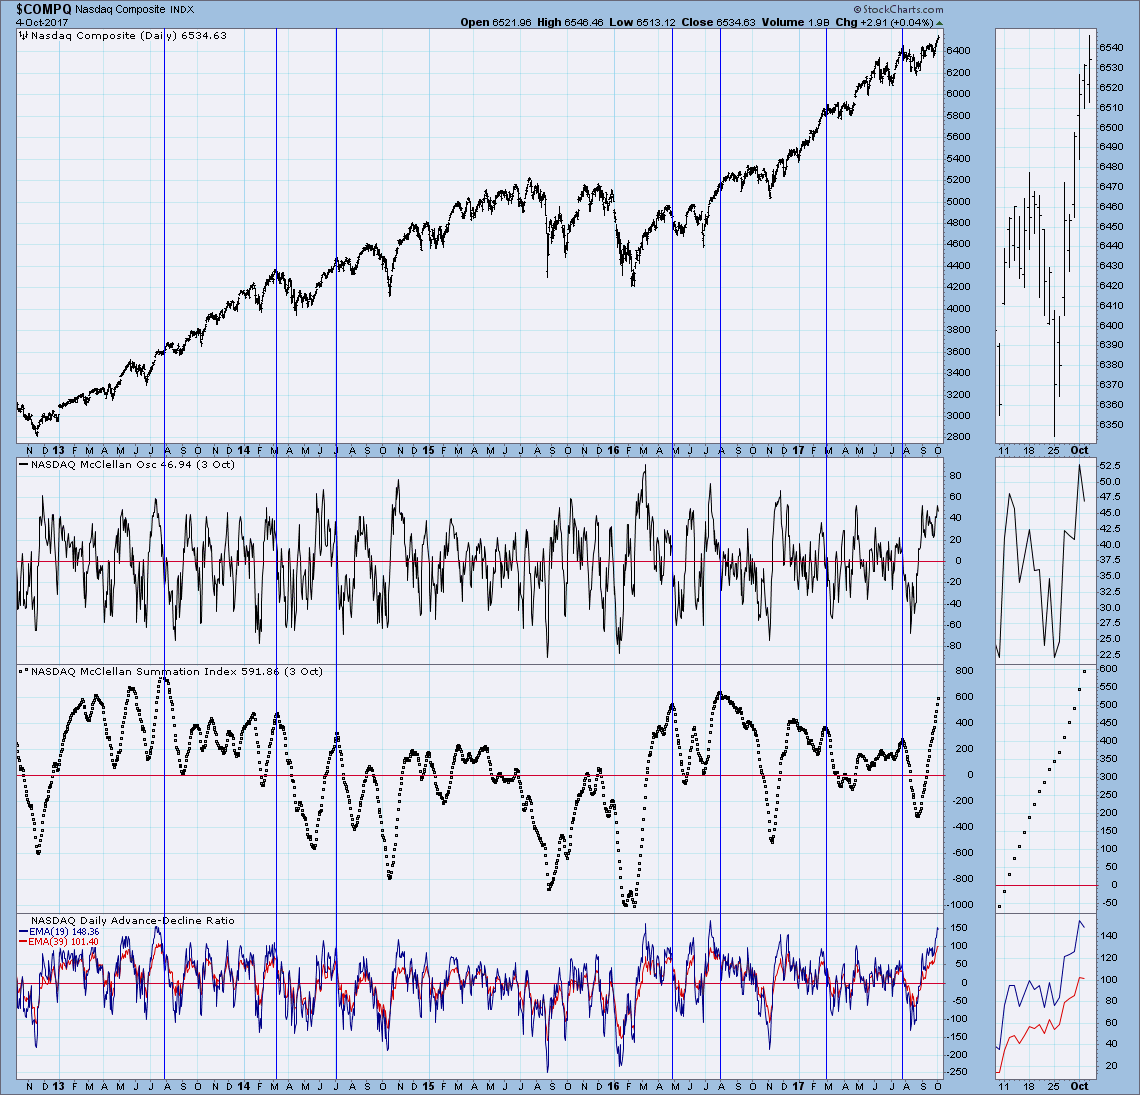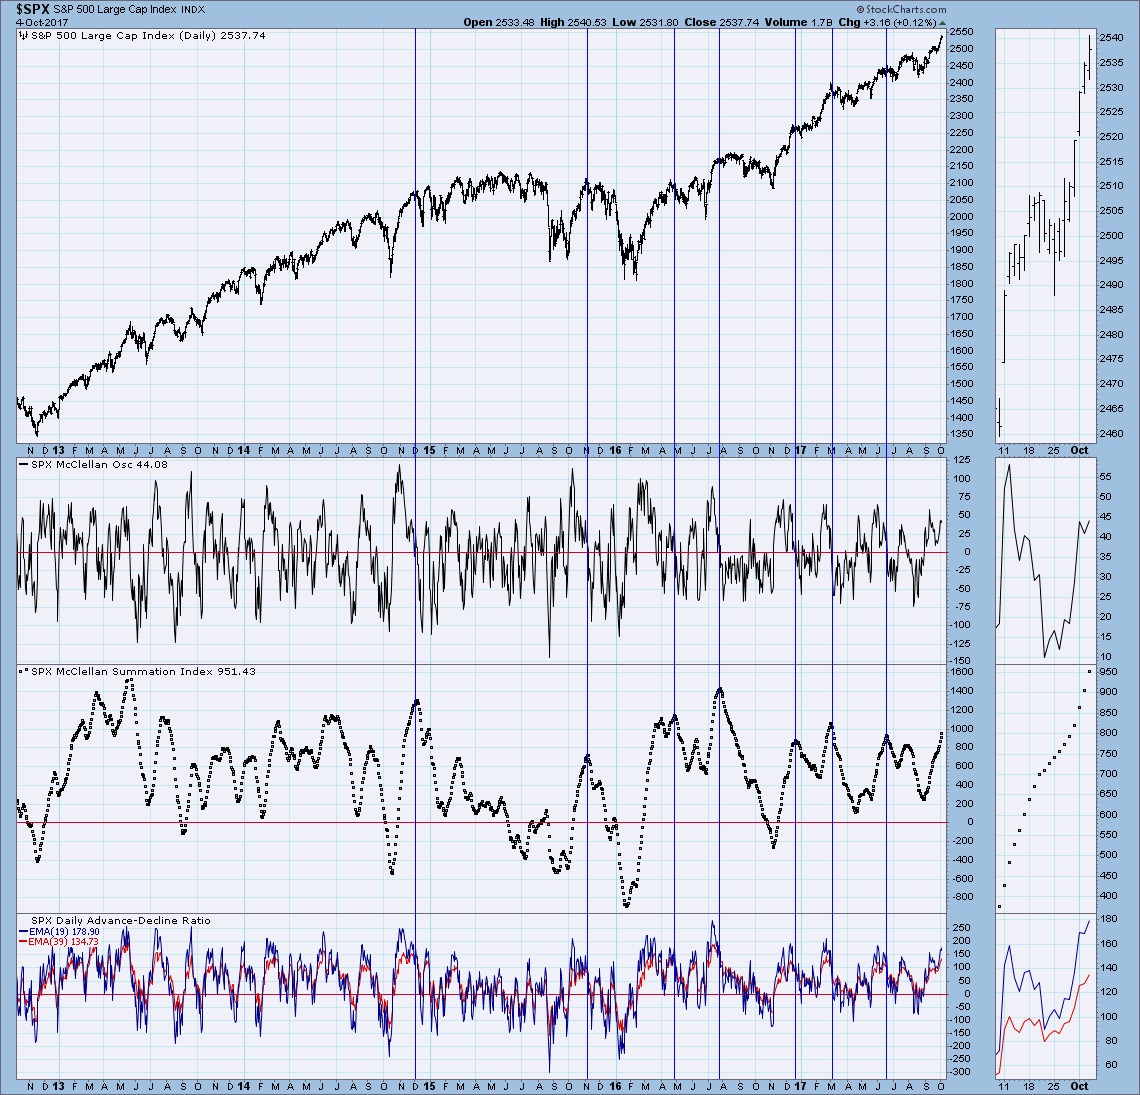
Developed by Sherman and Marian McClellan, the McClellan Summation Index is a breadth indicator derived the McClellan Oscillator, which is a breadth indicator based on Net Advances (advancing issues less declining issues). The Summation Index is simply a running total of the McClellan Oscillator values. Even though it is called a Summation Index, the indicator is really an oscillator that fluctuates above and below the zero line. The DecisionPoint Market Indicator ChartPack includes a ChartList of the McClellan Oscillator/Summation Index for the major indexes (NYSE, NASDAQ, NDX, SPX, OEX, DJIA, SP400 and SP600). I was reviewing these charts and found that the Summation Index is very overbought and rising on all of these indexes.
Notice that when the Summation Index turns over in overbought territory, the market usually responds with a correction, pullback or at least consolidation. Currently, all of these charts below show Summation Indexes that are very overbought. The good news is that all of them continue to rise. I would list these charts as "ones to watch" to keep a finger on the pulse of the market. We will want to see and know when the Summation Index tops because that's when trouble usually follows.
Conclusion: The Summation Index is overbought, but still rising strongly and that bodes well for the market. It also confirms the strong rally we've experienced since the end of August. However, when this indicator begins topping, we should be aware and cautious about the market's direction.
Helpful DecisionPoint Links:
DecisionPoint Shared ChartList and DecisionPoint Chart Gallery
Price Momentum Oscillator (PMO)
Swenlin Trading Oscillators (STO-B and STO-V)
Technical Analysis is a windsock, not a crystal ball.
Happy Charting!
- Erin
**Don't miss DecisionPoint Commentary! Add your email below to be notified of new updates"**


