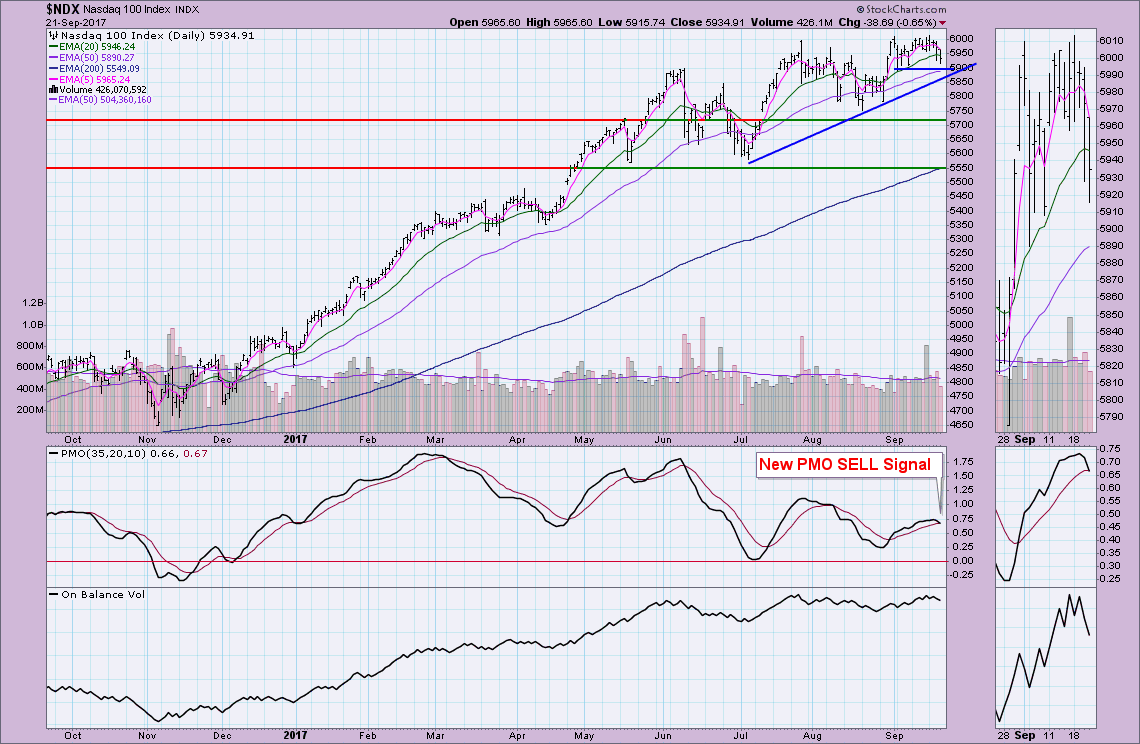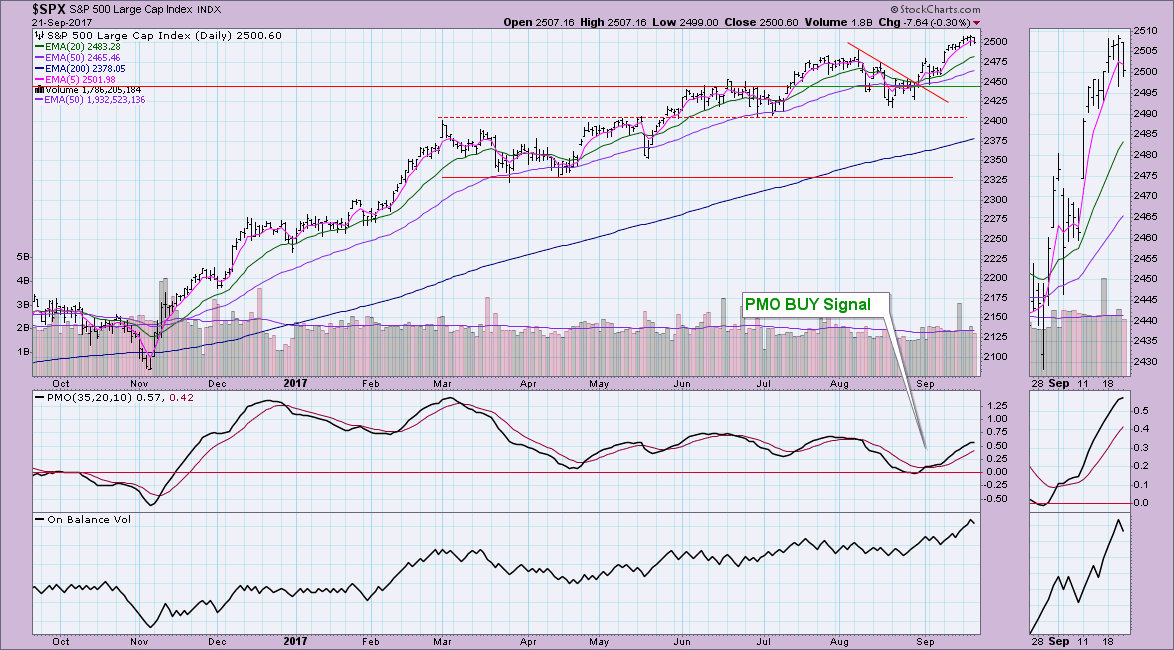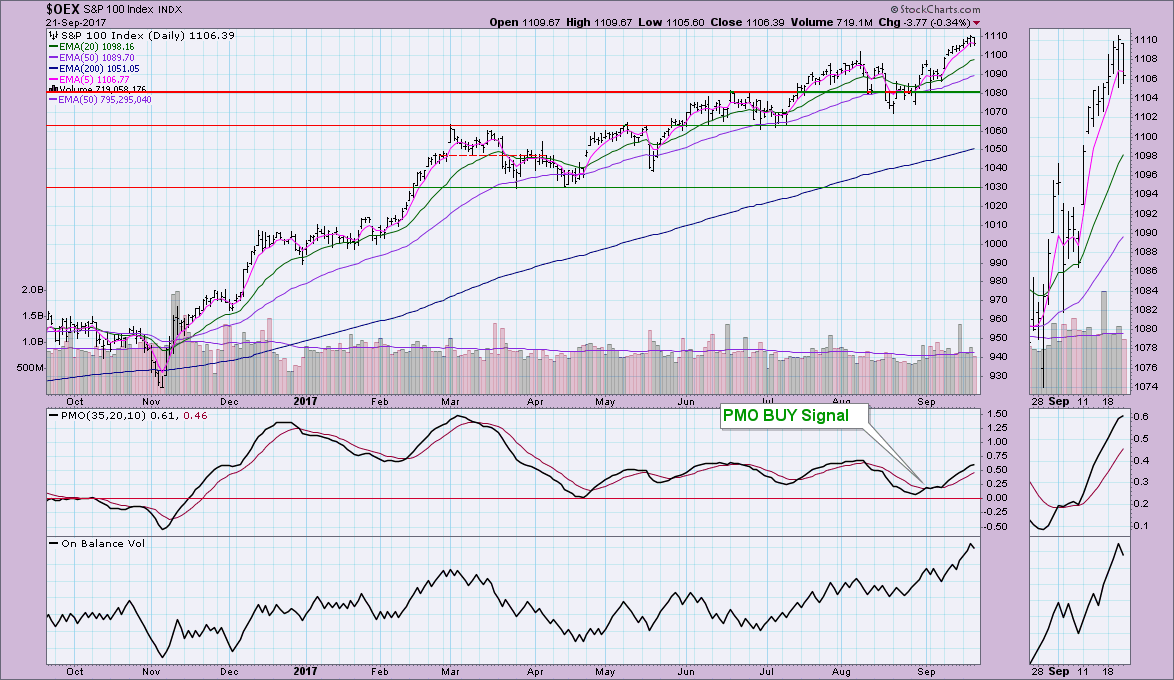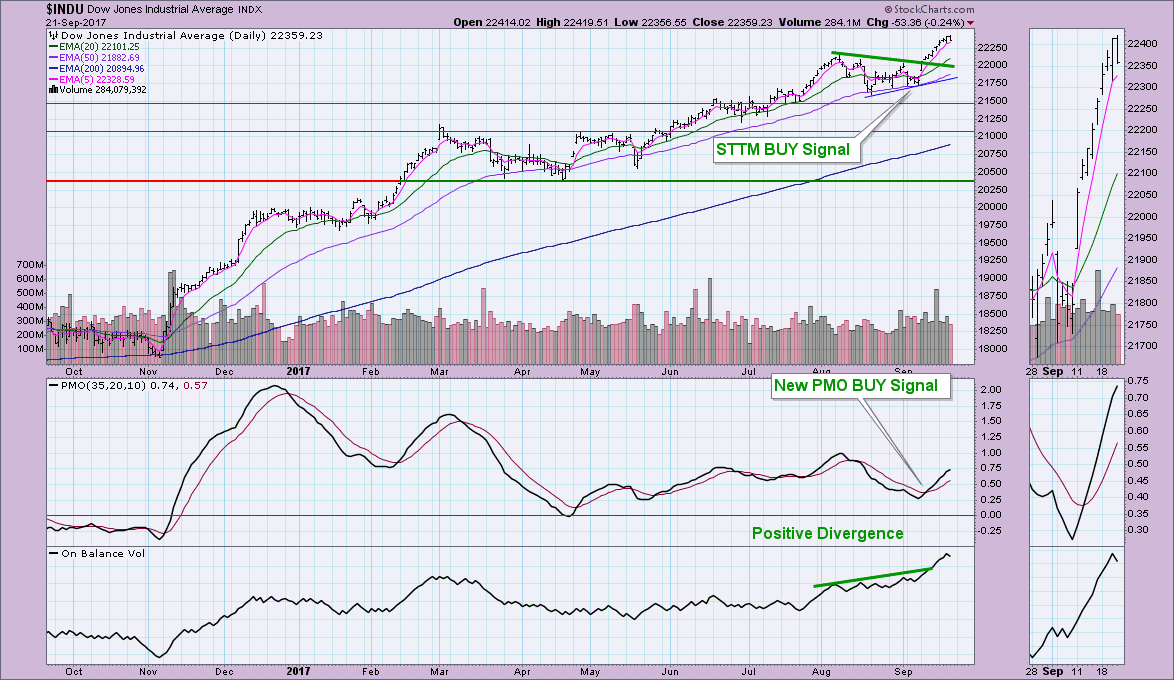
As you can see below, the NDX's steep decline has thrown the Price Momentum Oscillator (PMO) below its signal line. I don't expect to see similar readings from the other indexes as they haven't been hit as hard as techs on the latest declines. It also took the NDX some time to generate the original PMO BUY signal. You'll see on the daily charts for the other three indexes that PMO SELL signals are not likely unless we see a deeper decline.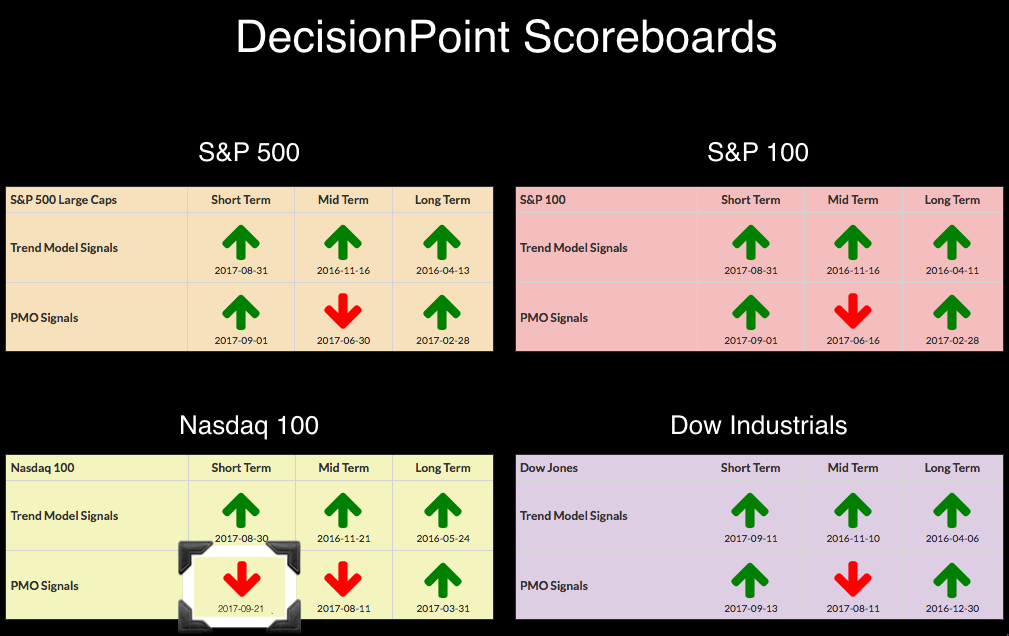
I'm not that worried about this PMO crossover SELL signal. Notice that there is "dual" support available at the 5900 level between the rising bottoms trendline and horizontal support from this month's lows. I'm not thrilled with the negative divergence that is apparent between PMO tops and price tops because support does appear so strong. Even if that level is broken, the lows around 5750 should hold up if it actually got to that point. The OBV tops have been in confirmation mode for the rally this summer, although this last one is technically a bit lower than the previous OBV top.
As you can see, the other indexes' PMOs look fairly "sticky". Their PMOs are still rising. In fact, the PMO on the Dow is rising strongly and isn't even showing signs of deterioration yet. In any case, these indicators all need to pullback somewhat out of overbought territory. The NDX had the most near-term weakness so it isn't surprising to see its signal disappear sooner, but as I said, I'm not looking for a deep correction. Since November, pullbacks and consolidation have cleared overbought conditions. I suspect that will be the case over the next week or so.
Helpful DecisionPoint Links:
DecisionPoint Shared ChartList and DecisionPoint Chart Gallery
Price Momentum Oscillator (PMO)
Swenlin Trading Oscillators (STO-B and STO-V)
Technical Analysis is a windsock, not a crystal ball.
Happy Charting!
- Erin
**Don't miss DecisionPoint Commentary! Add your email below to be notified of new updates"**

