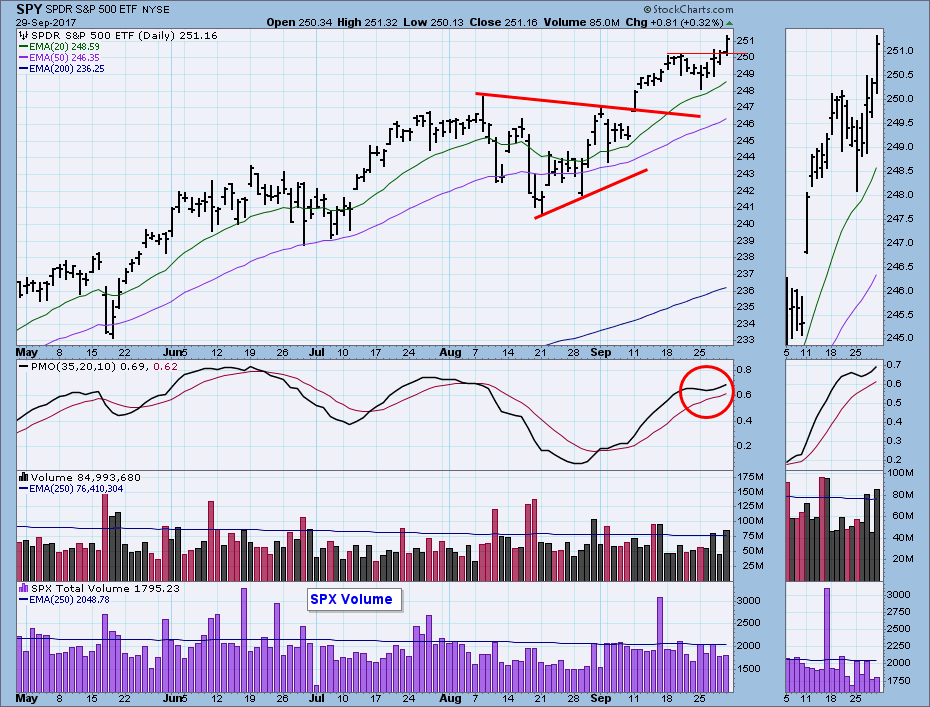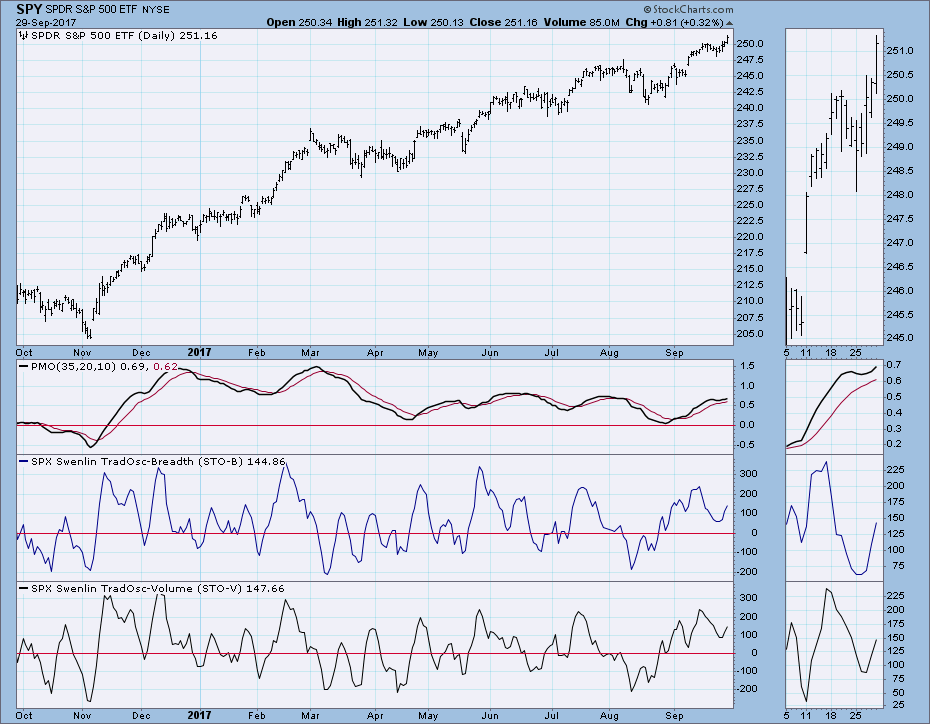
Last week I thought that a market correction was beginning, but all we got was a one-day, downside blip that ended at the low on Monday. From there the market edged higher, closing at new, all-time highs on Thursday and Friday. Nevertheless, the gain for the week was less than one percent, the market is overbought, and my outlook has not changed. That is to say, I think a small correction is likely.
The DecisionPoint Weekly Wrap presents an end-of-week assessment of the trend and condition of the stock market (S&P 500), the U.S. Dollar, Gold, Crude Oil, and Bonds.
STOCKS
IT Trend Model: BUY as of 11/15/2016
LT Trend Model: BUY as of 4/1/2016
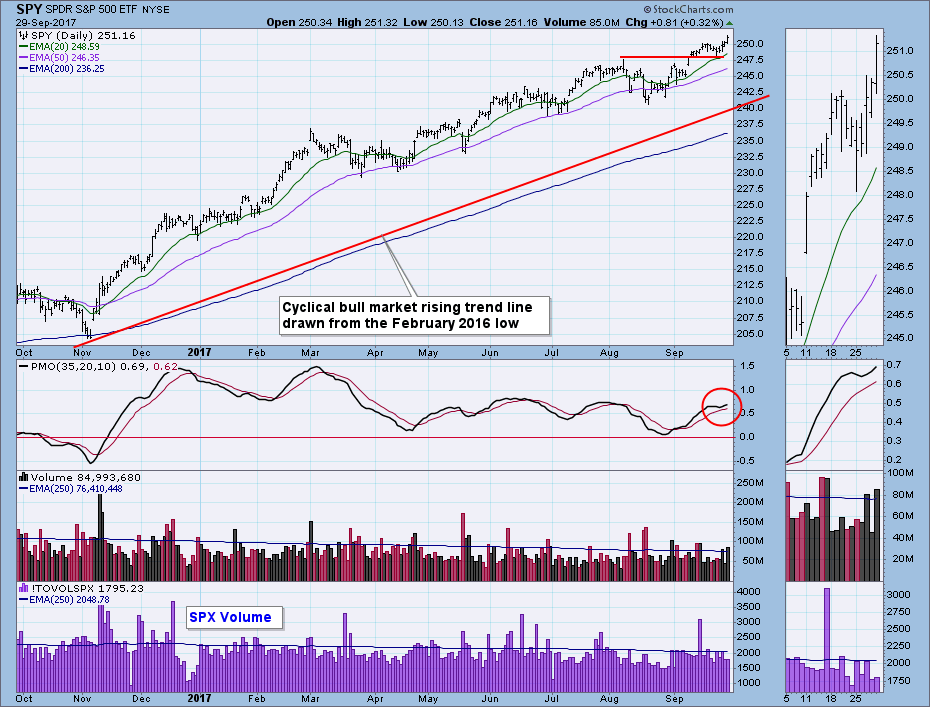
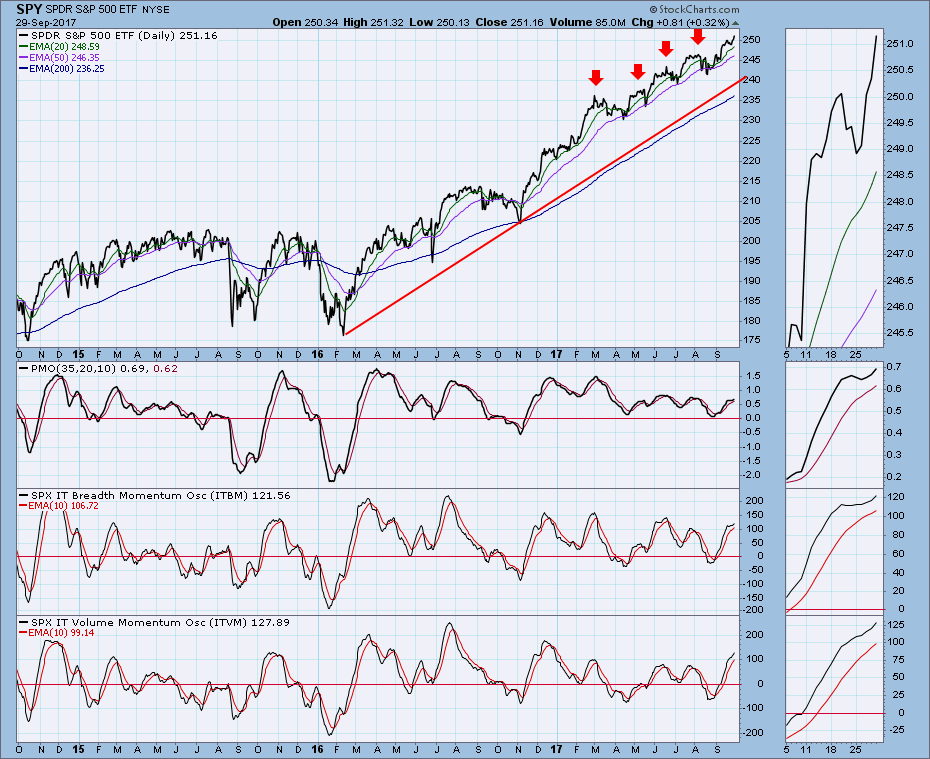
The daily PMO, which had topped last week, turned back up this week. (That configuration frequently is a sign of a top.) Nevertheless, the daily PMO is overbought, as are intermediate-term indicators, and price is very overbought relative to the cyclical bull market rising trend line.
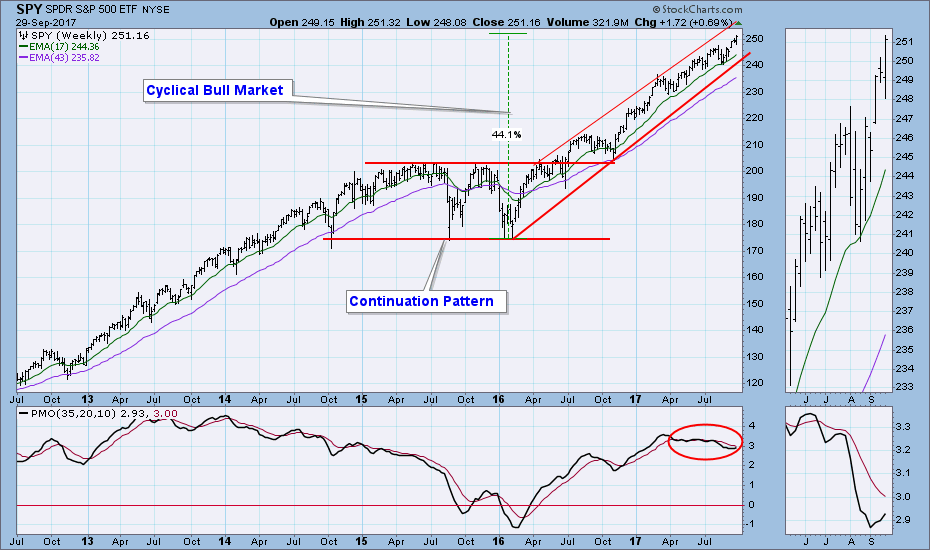
The weekly chart is bullish with price staying in the top half of the rising trend channel. The cyclical bull market is about 17 months old. A cyclical bull market within a secular bull market could last around 30 months. Understand that this is more of a WAG than firm target, but clearly the market shows a determination to press higher.
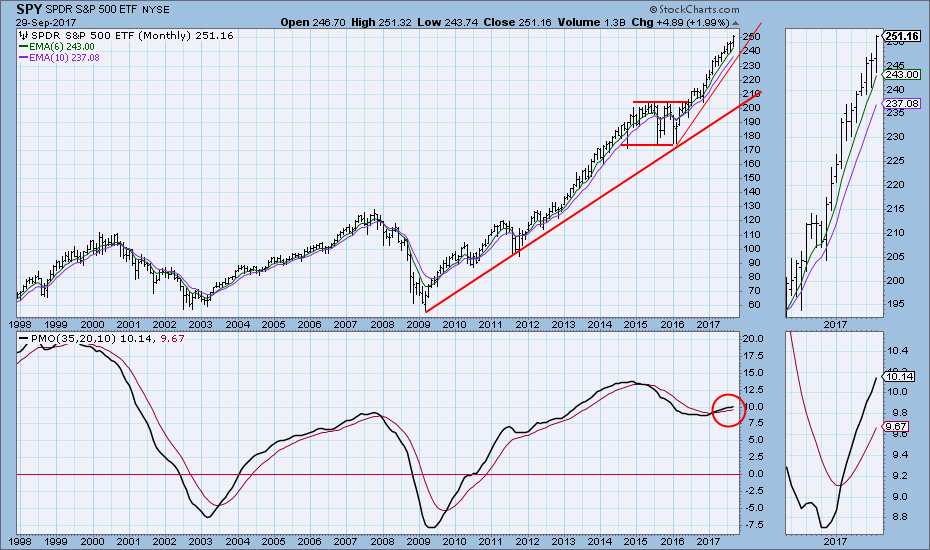
The monthly SPY chart is bullish with price being well above the secular bull market rising trend line. The monthly PMO is still rising, although, at a much slower rate. The problem that I see is that price is too far above the rising trend line drawn from the 2009 low. At the very least, this configuration is setting the market up for a correction to move price back toward the rising trend line. Note that a similar setup in 2015 resulted in a sideways move with a correction depth of about -14%. A more accelerated move back down to the rising trend line would result in a correction of around -20%, which would qualify as a cyclical bear market.
Short-Term Market Indicators: They are rising out of the neutral zone and still have room to move higher before they are overbought.
Intermediate-Term Market Indicators: Relative to their one-year range, these indicators are overbought.
Conclusion: For the last 10 months the market's advance has been steady and accelerated, and there is still no sign that this energetic advance is going to expire anytime soon. There is plenty of room for price to correct back to the cyclical bull market rising trend line without doing serious technical damage, but price action seems to indicate that a pullback to the 50EMA is about the most correction we are going to get. I expect that minor pullback to happen soon.
DOLLAR (UUP)
IT Trend Model: NEUTRAL as of 3/21/2017
LT Trend Model: SELL as of 5/24/2017
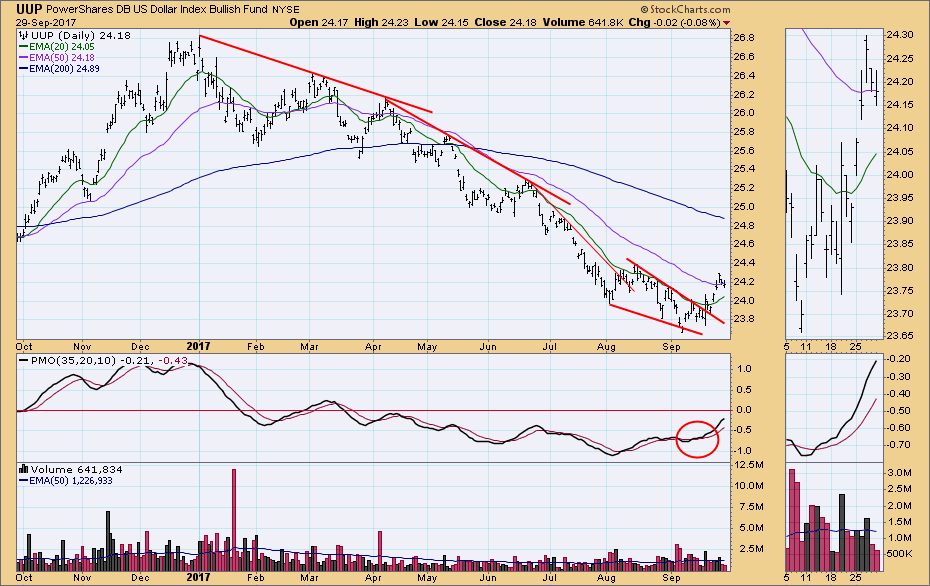
Price was sluggish after UUP's breakout last week, but this week price broke higher, and the 50EMA was recaptured. Considering the weekly and monthly charts below, I expect the dollar rally to continue.
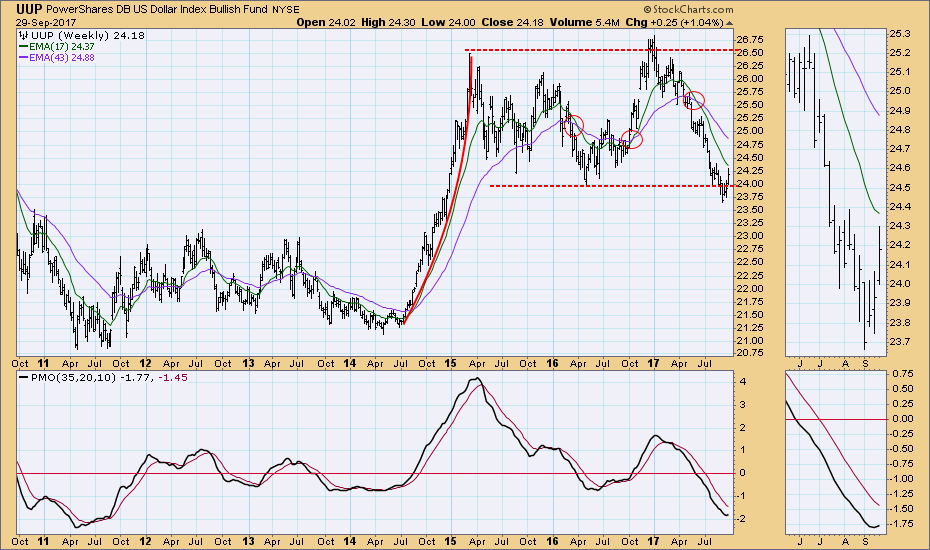
Whereas last week I thought that broken support signaled more selling ahead, price has bounced back above the line and the weekly PMO has bottomed.
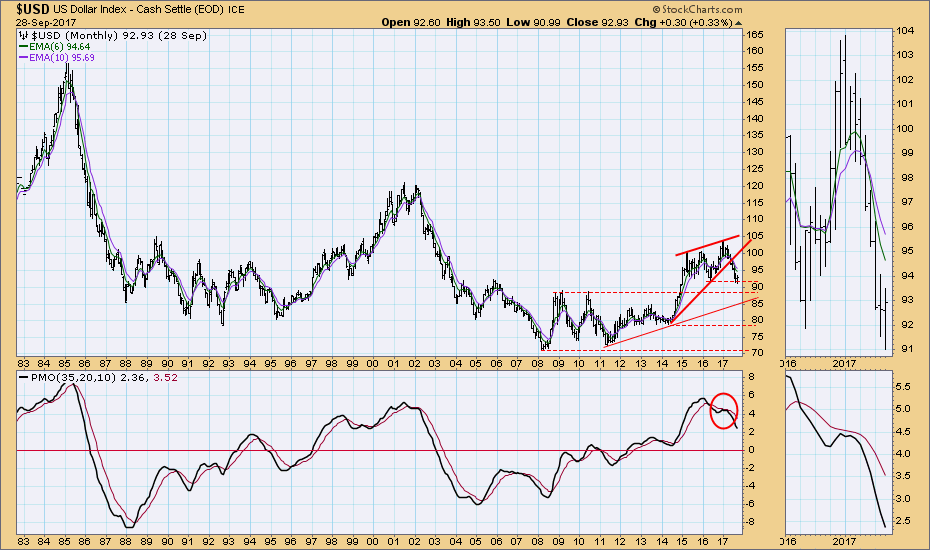
For the monthly chart I will use $USD because of the longer-term data that is available. Price broke down from a rising wedge, which was the technical expectation. Price bounced off a line of support, which may prove to be the neckline of a head and shoulders pattern.
GOLD
IT Trend Model: BUY as of 7/31/2017
LT Trend Model: BUY as of 4/12/2017
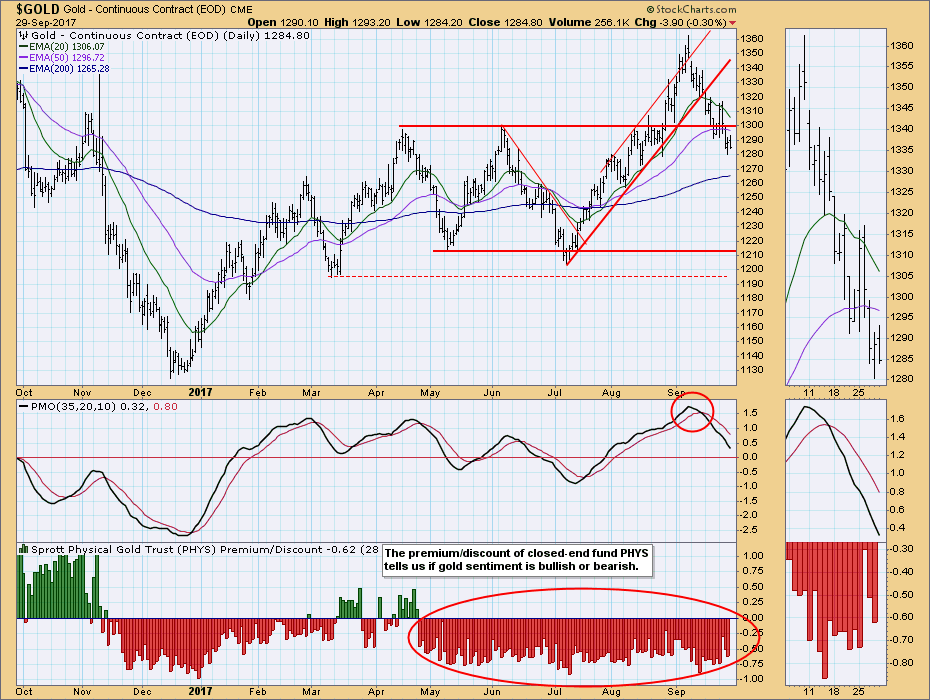
Gold clearly broke through support this week, and the emerging strength in the dollar discourages optimism that gold will resume its rally.
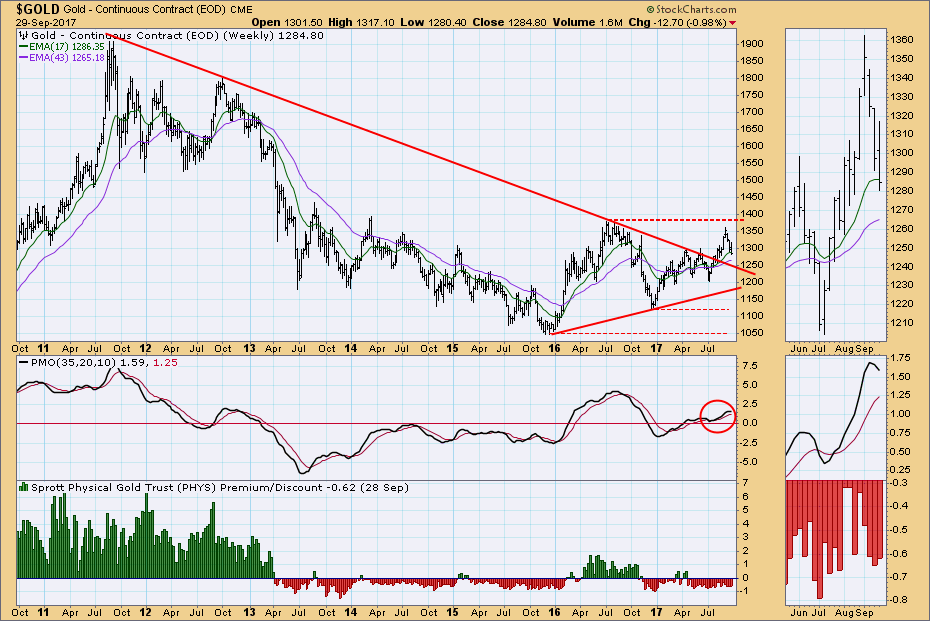
Last week the weekly PMO for gold turned down, and price continues down toward a possible retest of the long-term declining tops line. To clearly establish a long-term rising trend, price must rise above the 2016 top.
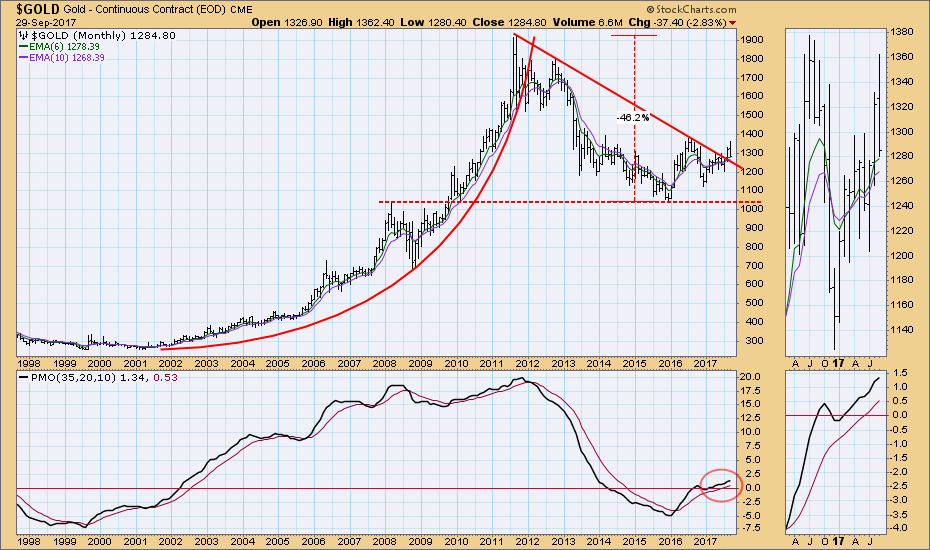
The long-term picture for gold remains bullish. The breakout above the declining tops line has held, and the monthly PMO is rising.
CRUDE OIL (USO)
IT Trend Model: BUY as of 9/6/2017
LT Trend Model: SELL as of 3/9/2017
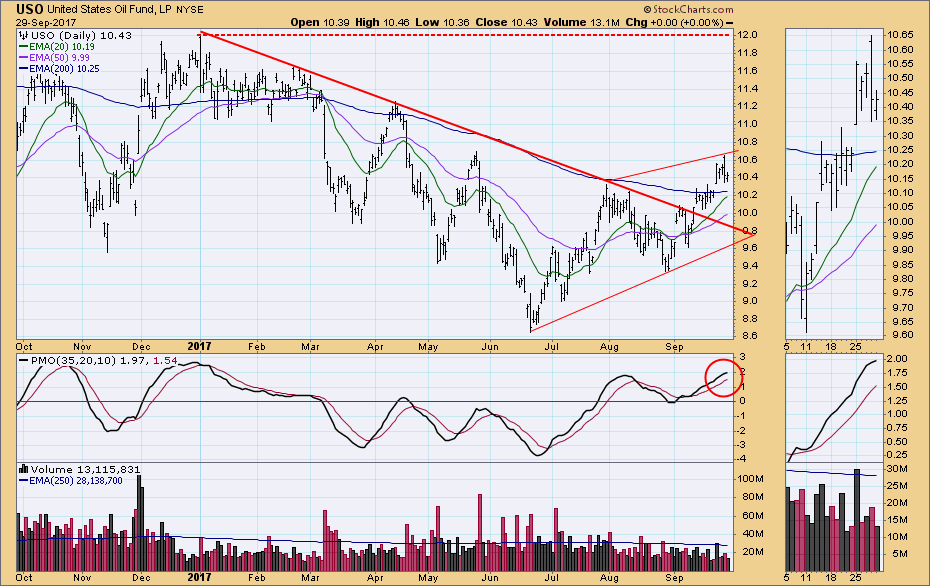
This week USO moved above the 200EMA and is consolidating. I note that the daily PMO looks as if it wants to top, but a breakout from this week's consolidation will prevent that from happening.
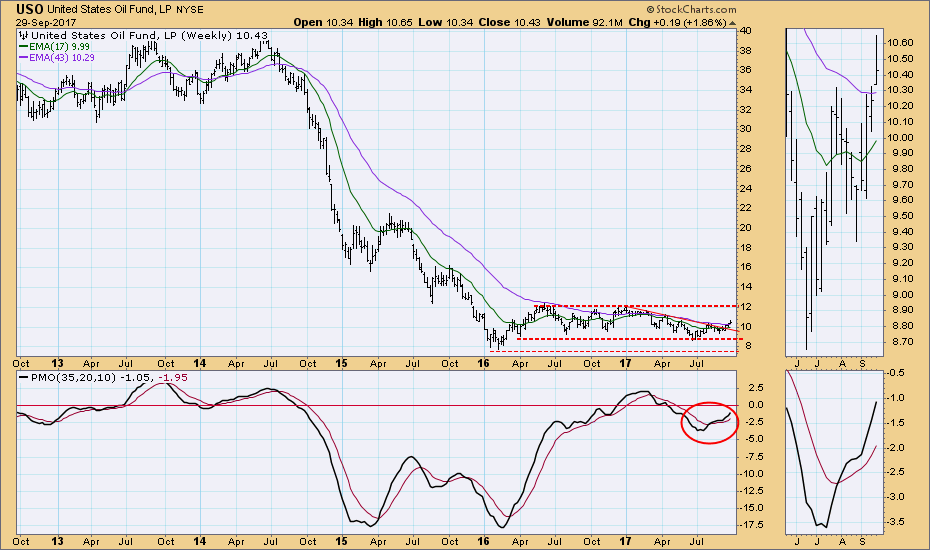
USO has broken above the declining tops line, and a rally to the top of the trading range seems likely.
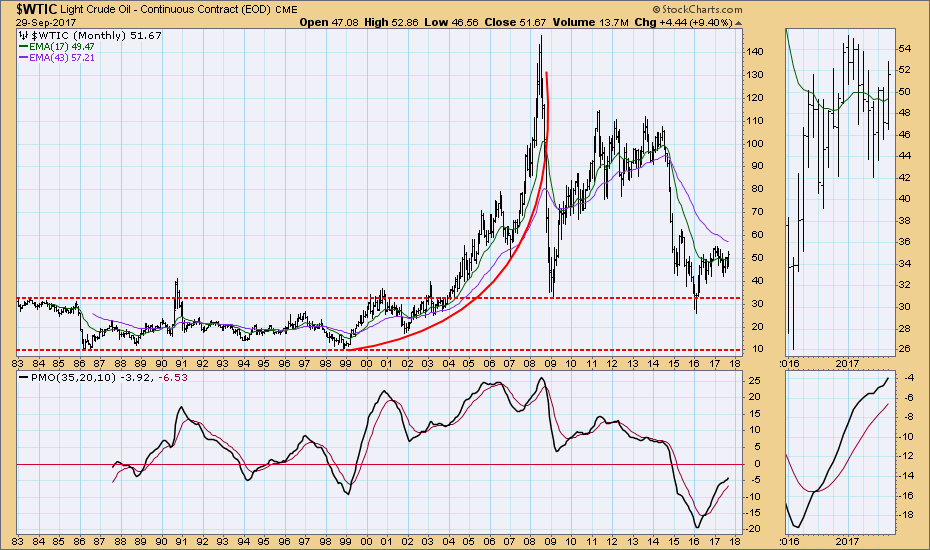
For the monthly view I will use the $WTIC chart because of the deeper data available. We can see that crude has been rallying for about 18 months, but it seems to be rolling over. Nevertheless, the monthly PMO is rising, which keeps me from getting too bearish on this chart.
BONDS (TLT)
IT Trend Model: BUY as of 3/31/2017
LT Trend Model: BUY as of 6/16/2017
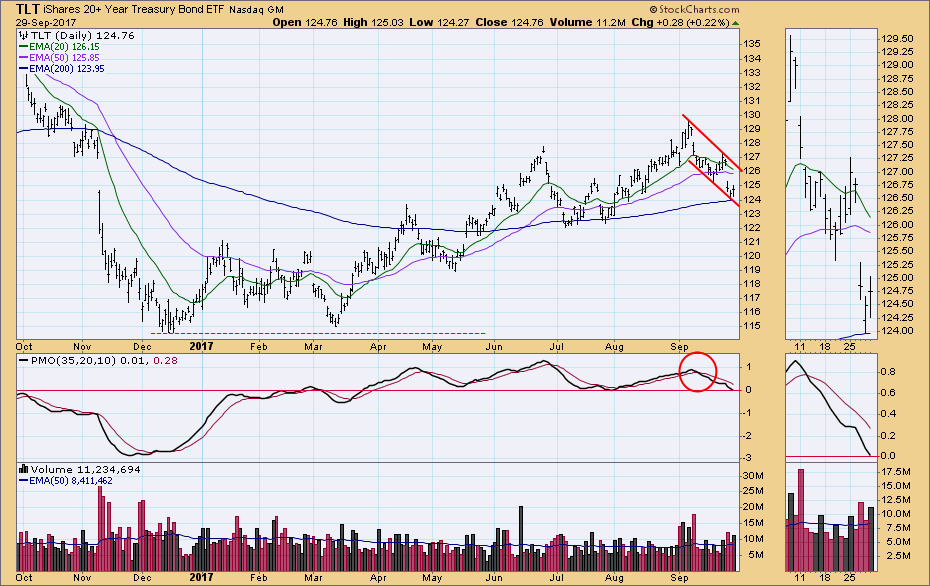
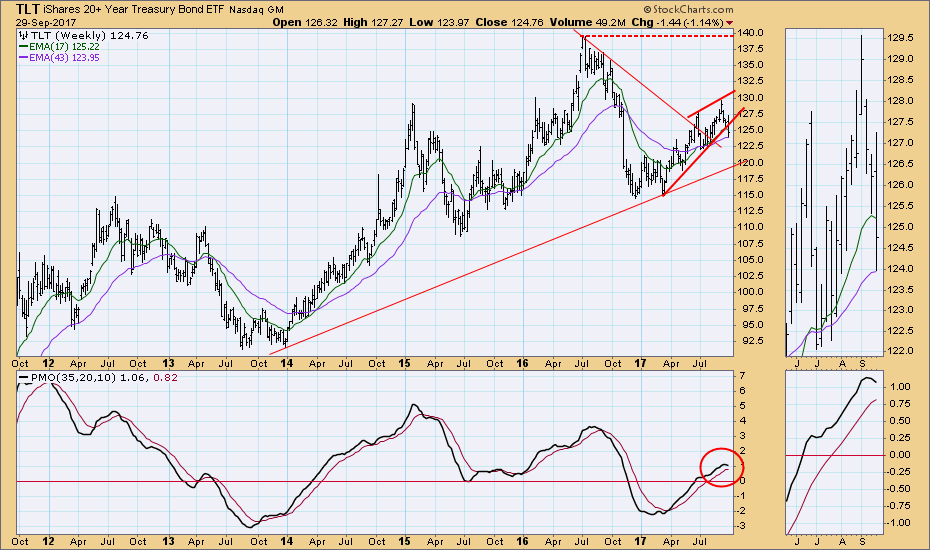
TLT has dropped to the bottom of a declining trend channel. A bounce is not out of the question.
The weekly PMO topped last week, and this week TLT broke down from the rising wedge formation, as was the technical expectation.
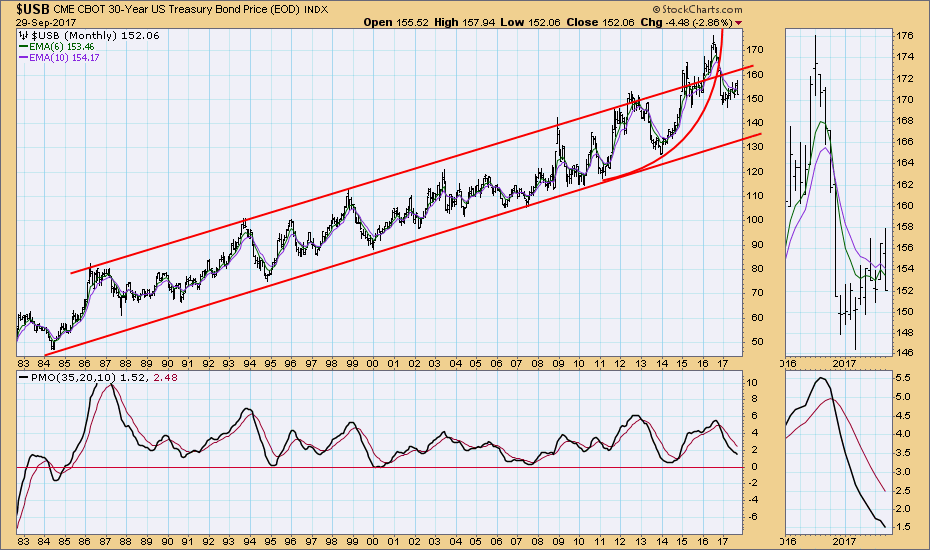
For the monthly view I will, as usual, use $USB because it has much deeper data than TLT. Note the parabolic advance beginning from the 2011 low. The upward curve was broken in 2016, and a bearish reverse flag has been forming since the beginning of this year. The technical expectation is that the flag will resolve downward. The monthly PMO is getting oversold, based upon the PMO lows of the last 25 years.
**Don't miss any of the DecisionPoint commentaries! Go to the "Notify Me" box toward the end of this blog page to be notified as soon as they are published.**
Technical Analysis is a windsock, not a crystal ball.
Happy Charting!
- Carl
NOTE: The signal status reported herein is based upon mechanical trading model signals, specifically, the DecisionPoint Trend Model. They define the implied bias of the price index based upon moving average relationships, but they do not necessarily call for a specific action. They are information flags that should prompt chart review. Further, they do not call for continuous buying or selling during the life of the signal. For example, a BUY signal will probably (but not necessarily) return the best results if action is taken soon after the signal is generated. Additional opportunities for buying may be found as price zigzags higher, but the trader must look for optimum entry points. Conversely, exit points to preserve gains (or minimize losses) may be evident before the model mechanically closes the signal.
Helpful DecisionPoint Links:
DecisionPoint Shared ChartList and DecisionPoint Chart Gallery
Price Momentum Oscillator (PMO)
Swenlin Trading Oscillators (STO-B and STO-V)

