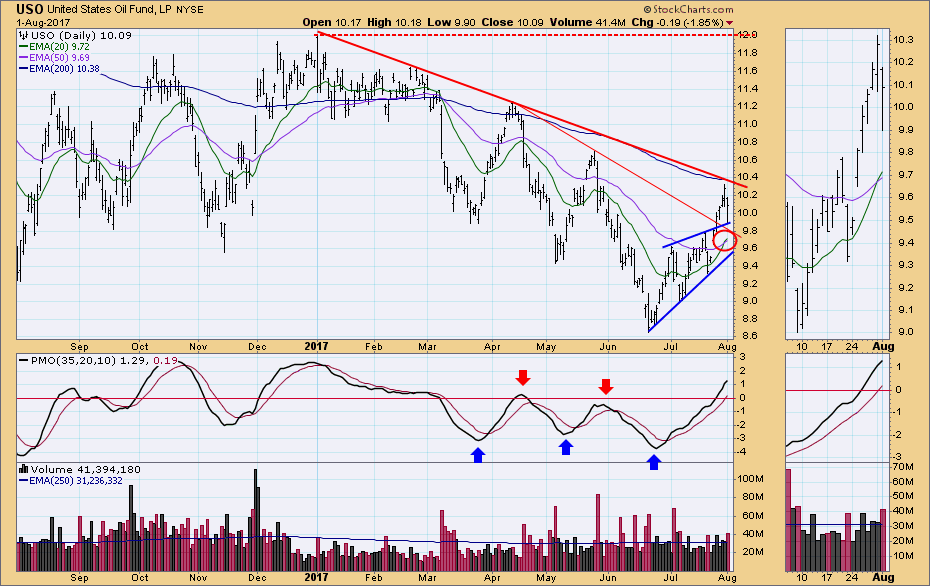
Today a new IT Trend Model (ITTM) BUY signal was generated by U.S. Oil Fund (USO), our surrogate for crude oil, when the 20EMA crossed up through the 50EMA. This looks like a case where the signal is a bit late in arriving due to the severe selling that took place before price finally bottomed -- the EMAs were so far apart to the downside that it took a substantial rally to pull them back together.
The first bullish sign appeared over a month ago when the daily PMO bottomed. When price movements are as volatile as we can see on the chart, PMO direction changes can provide a good early action signal, as is evidenced by the price action that followed the two previous PMO bottoms and tops. After price bottomed in June, it formed a bearish rising wedge pattern, a pattern that normally resolves downward. The fact that it resolved upward was a second bullish sign. At the same time price broke out of the wedge, a declining tops line was also penetrated.
Yesterday price reached the resistance zone presented by the 200EMA and the primary declining tops line, and today it pulled back toward the point of breakout. With all the bullish action we have seen, I assume that the rally will continue for a while.
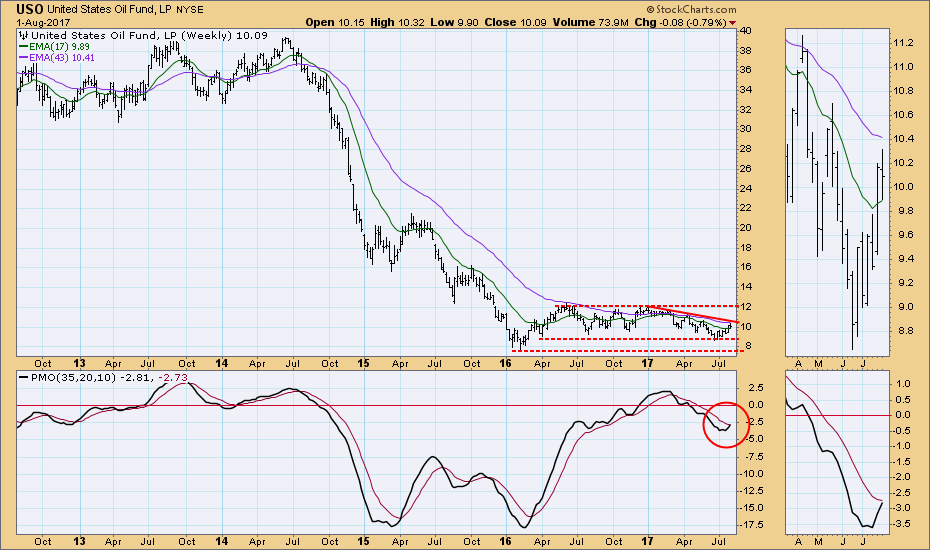
The weekly chart below shows that the weekly PMO has bottomed, and we can see that price has plenty of room to rally within the 15-month trading range. But the declining tops line will have to be overcome first.
Helpful DecisionPoint Links:
DecisionPoint Shared ChartList and DecisionPoint Chart Gallery
Price Momentum Oscillator (PMO)
Swenlin Trading Oscillators (STO-B and STO-V)
Technical Analysis is a windsock, not a crystal ball.
Happy Charting!
- Carl
**Don't miss DecisionPoint Commentary! Add your email below to be notified of new updates"**


