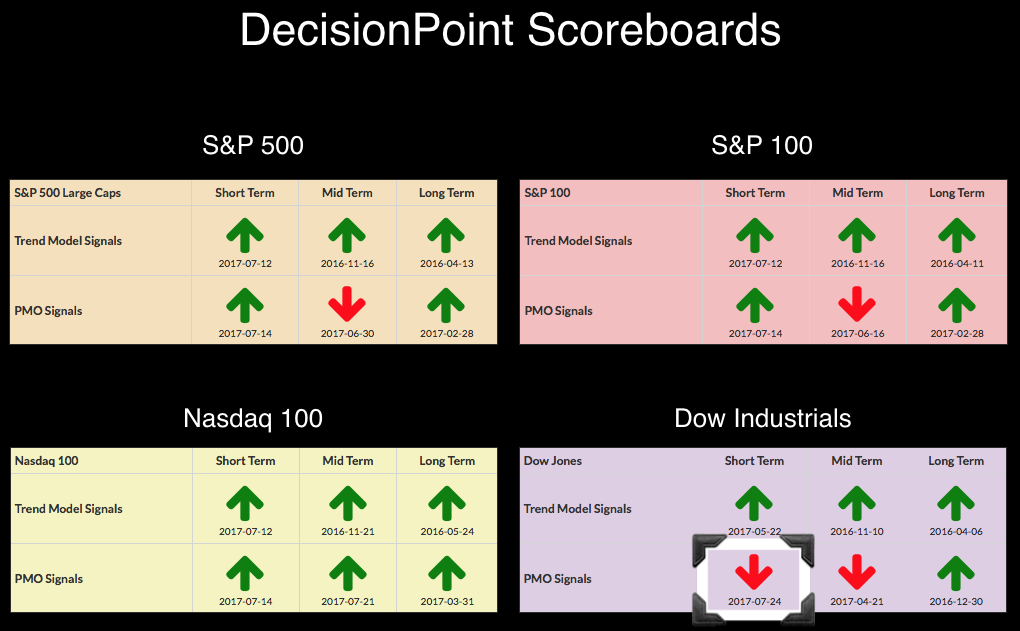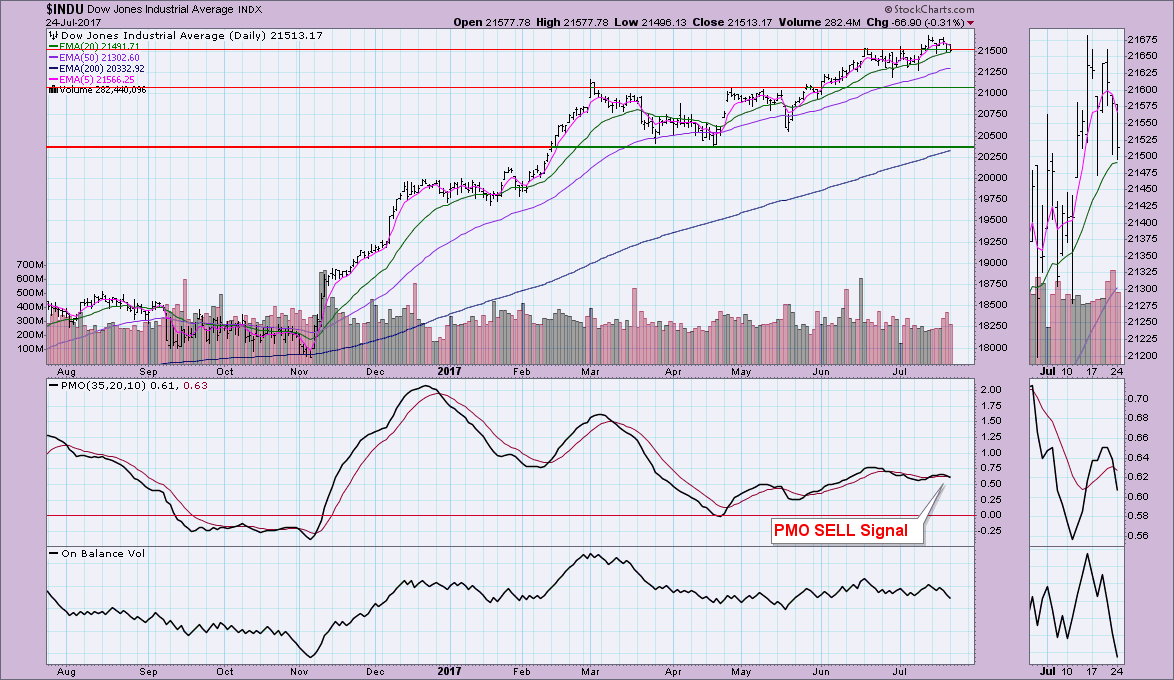
Today the Dow Industrials ($INDU) lost its recent PMO BUY signal from 7/14 and has logged a PMO SELL signal on the DP Scoreboard. The chart is below.

It looks like a short-term double-top in the thumbnail. Support is holding at 21500, but this recent PMO SELL signal and the OBV setting up negative divergences between price bottoms and OBV bottoms.
Helpful DecisionPoint Links:
DecisionPoint Shared ChartList and DecisionPoint Chart Gallery
Price Momentum Oscillator (PMO)
Swenlin Trading Oscillators (STO-B and STO-V)
Technical Analysis is a windsock, not a crystal ball.
Happy Charting!
- Erin
**Don't miss DecisionPoint Commentary! Add your email below to be notified of new updates"**

