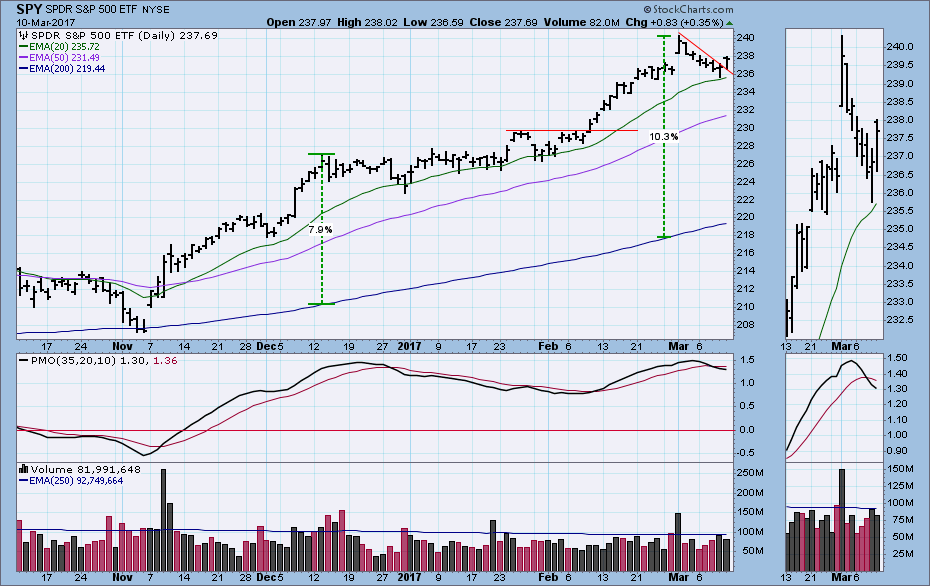
Trying to attribute every market up or down tick to news/fundamental events is a fool's errand, but every once in a while the connection between seems pretty obvious. The day after President Trump's address to congress, the market gapped up in response; however, it immediately began a pullback over several days, which filled the gap and then some. Another issue after the up gap was that price was extended +10% above the 200EMA, a distance that begged for some downside relief. Such corrective action began the following day, and ended on Thursday. On Friday price broke above the short-term declining tops line, implying that the pullback was over.
As pullbacks go this one was unimpressive and labored, showing that the market did not give ground easily. The only problem with Friday's breakout was that it was accomplished on contracting volume.
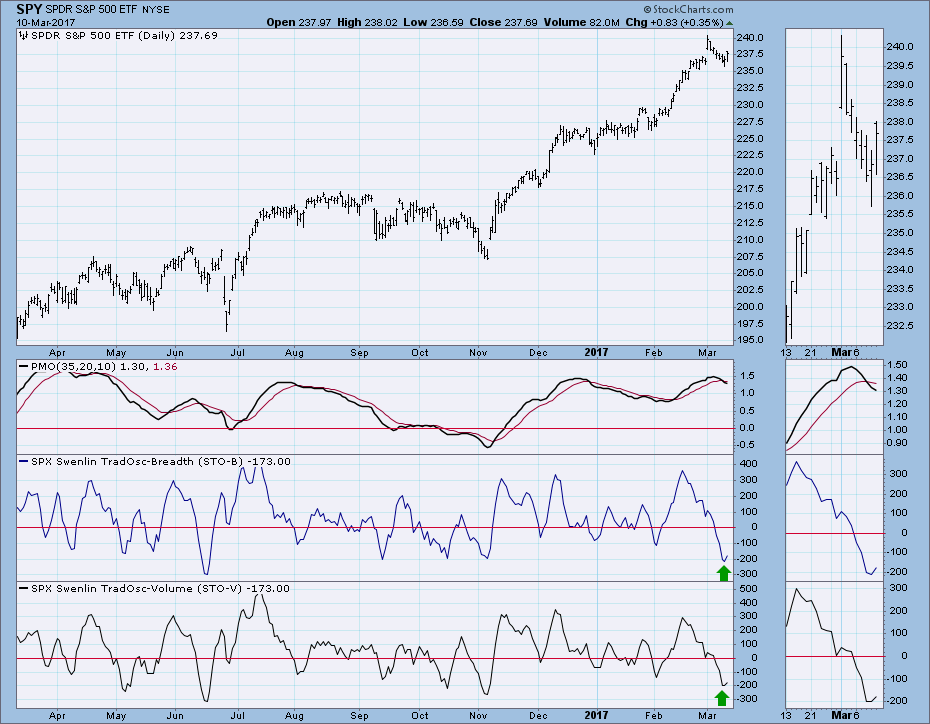
Looking deeper into the internal condition of the market, our short-term indicators below are modestly oversold and rising, so there is plenty of room for more upside price action within this time frame.
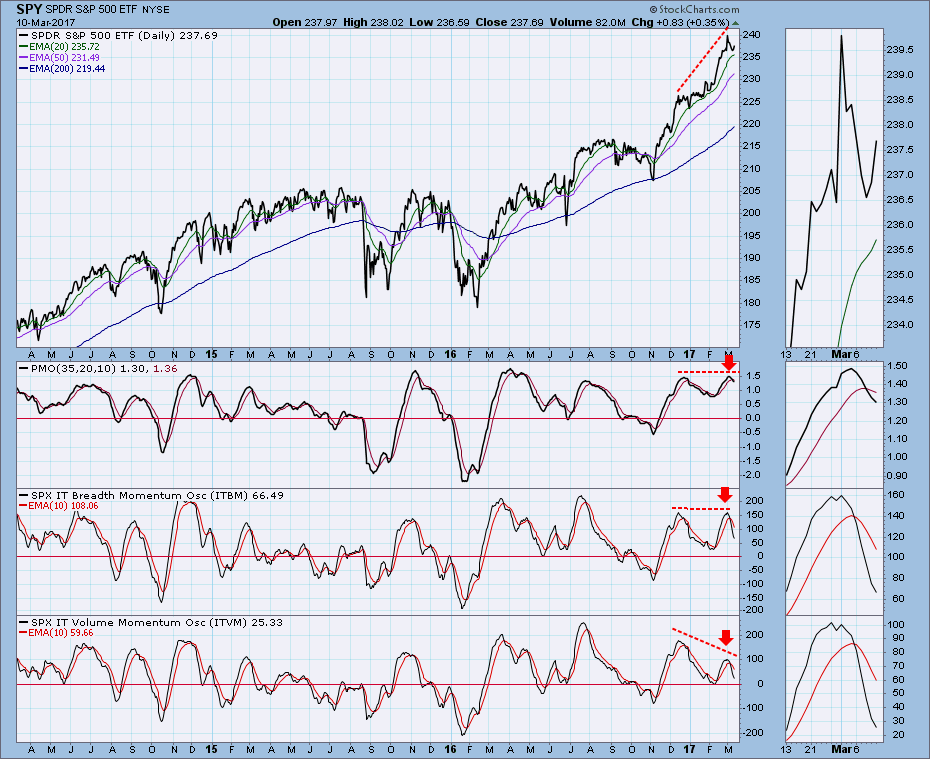
Our intermediate-term (IT) indicators below are showing a negative divergence against the rising price tops, and they are falling below their signal lines. The ITBM (breadth) and ITVM (volume) oscillators are close enough to the zero line to allow for a continuation of rising prices, meaning that they could reverse and move higher within their normal range. The PMO (Price Momentum Oscillator) is overbought, but it is still below the top of its normal range, which is about +2.0. These configurations are far from the ideal we'd like to see as evidence for a continued rally (i.e. deeply oversold and bottoming), but that hasn't happened since the beginning of the cyclical bull market in early-2016. Bull market rules.
CONCLUSION: Oversold and bottoming short-term indicators, along with a price breakout are evidence that the short correction is over. Also, intermediate-term indicators are not an obstacle to higher prices, so at this point I'd have to say that further price decline is unlikely. The fact that the Fed will probably raise interest rates on Wednesday provides some fundamental headwinds, but I think that the market has already digested that expectation.
The NEW DecisionPoint LIVE public ChartList has launched! Click on the link and you'll find webinar charts annotated just before the program. Additional "chart spotlights" will be included at the top of the list. Be sure and bookmark it!
Come check out the DecisionPoint Report with Erin Heim on Wednesdays and Fridays at 7:00p EST, a fast-paced 30-minute review of the current markets mid-week and week-end. The archives and registration links are on the Homepage under “Webinars”.
Technical Analysis is a windsock, not a crystal ball.
Happy Charting!
- Carl


