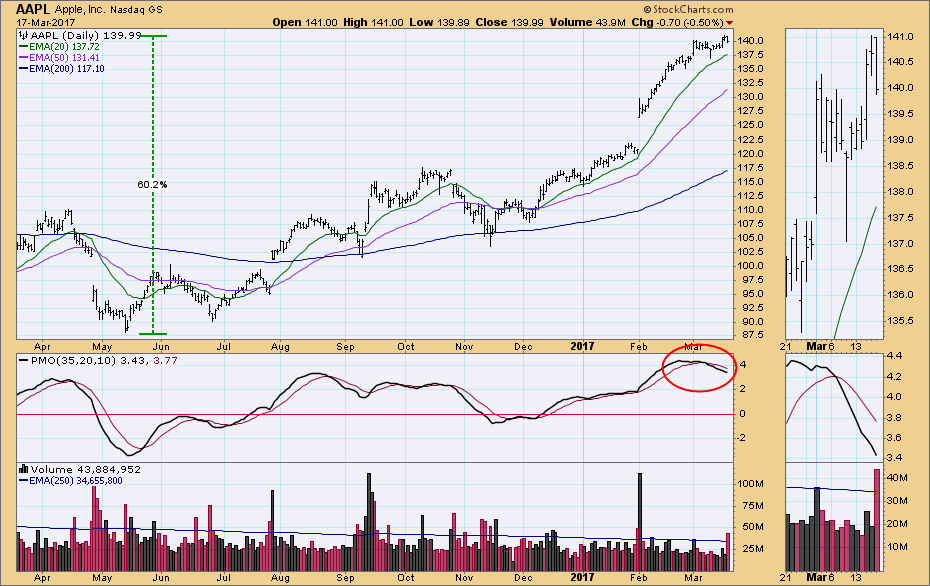
Apple (AAPL) has rallied +60% from its May 2016 low, which was also the the low for the previous bear market for AAPL. The price advance for the last month-and-a-half has been pretty vigorous, but the PMO (Price Momentum Oscillator) has topped and crossed down through its signal line, so a correction seems likely.
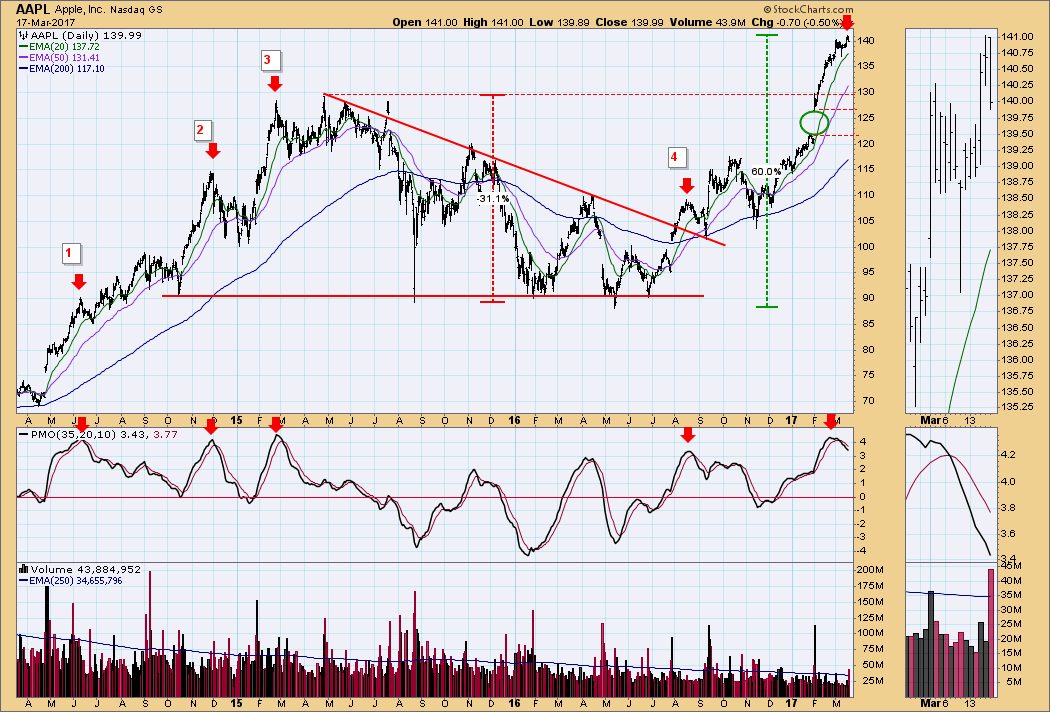
As usual, I like to look at a longer-term chart to enhance my perspective. In the middle of the three-year chart below we can see the previous AAPL bear market that lasted from mid-2015 to mid-2016. I have highlighted four previous bull market corrections so we can estimate how difficult a correction might be now. I ignored the corrections during the bear market period, because we are currently in a bull market, and comparisons would be invalid. (Dare I say, "like apples and oranges?")
The first correction, number 1, is scarcely a correction at all. It marks a point where momentum slows, but price moves higher while the PMO works its way lower. The other three corrections do produce varying degrees of price pullback. For this example, I have chosen PMO tops that are clean and very overbought because they match the current PMO top; although, we can see that not-so-overbought PMO tops can be dangerous as well.
CONCLUSION: Currently, AAPL's price is very extended, and the PMO has generated a SELL signal. Comparing the current PMO configuration, which is overbought and topping, to similar PMO tops in the past, makes me think that a pullback/correction is likely. As for the potential downside, the February 1 up gap sure does present a great big target, as does the support of the 2015 top; however, those targets seem a bit ambitious for a bull market environment.
The NEW DecisionPoint LIVE public ChartList has launched! Click on the link and you'll find webinar charts annotated just before the program. Additional "chart spotlights" will be included at the top of the list. Be sure and bookmark it!
Come check out the DecisionPoint Report with Erin Heim on Wednesdays and Fridays at 7:00p EST, a fast-paced 30-minute review of the current markets mid-week and week-end. The archives and registration links are on the Homepage under “Webinars”.
Technical Analysis is a windsock, not a crystal ball.
Happy Charting!
- Carl


