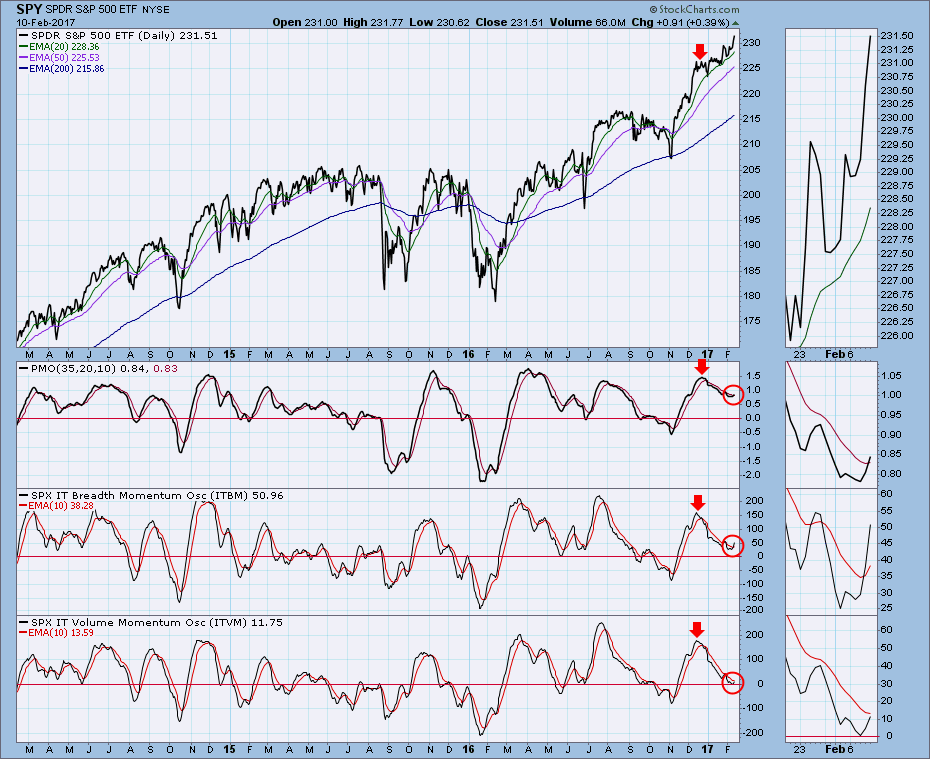
Just before Christmas I wrote an article saying I was expecting a correction or consolidation because our primary intermediate-term indicators had all topped. On the chart below we can see the annotations (down arrows) I made at the time, and we can see what actually happened. There was a small correction into the end of the year, then price rebounded and consolidated for about three weeks -- not really what I had in mind. There was an internal correction, wherein the indicators moved back toward their zero lines, even as price continued higher. Again, not really what I was expecting.
I should emphasize that all three indicators did correct, and, while not oversold, they are more or less neutral with plenty of room to move higher. They have turned up, and two of them have crossed up through their signal lines. This is bullish and supports the idea that the market has more upside to come.
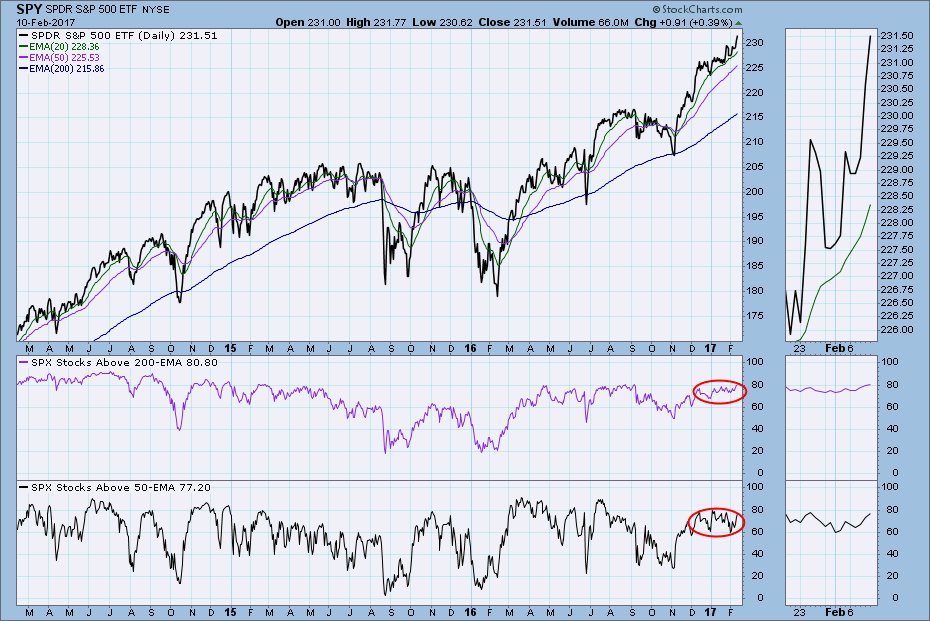
Another set of indicators may explain why a correction failed to materialize. The following chart shows the percentage of S&P 500 stocks above their 200EMAs and 50EMAs. Notice how those indicators remained relatively steady and high within their normal ranges. Essentially, some stocks corrected a bit, but the majority held their ground.
Both indicators are currently overbought, but that is not always bad in a bull market. I'd be more concerned if their readings were really overbought at 90 or higher.
CONCLUSION: We are in a bull market, so we should expect bullish outcomes. They, of course, are not guaranteed, but the bullish action we have observed over the last two months is the kind of thing that is likely to continue as long as the bull is in charge. As for what is next, the top chart shows our primary intermediate-term indicators in a bullish configuration, and the bottom chart shows that there is broad participation. The picture is bullish.
The NEW DecisionPoint LIVE public ChartList has launched! Click on the link and you'll find webinar charts annotated just before the program. Additional "chart spotlights" will be included at the top of the list. Be sure and bookmark it!
Come check out the DecisionPoint Report with Erin Heim on Wednesdays and Fridays at 7:00p EST, a fast-paced 30-minute review of the current markets mid-week and week-end. The archives and registration links are on the Homepage under “Webinars”.
Technical Analysis is a windsock, not a crystal ball.
Happy Charting!
- Carl


