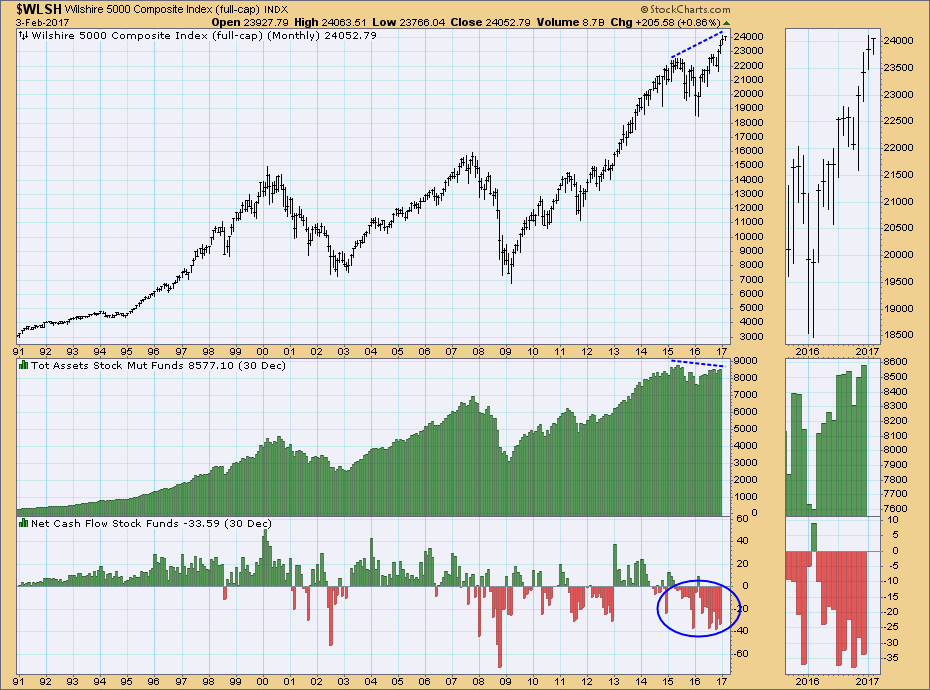
With some broad market indexes making record highs, one would think that total mutual fund assets would be following suit. But no. As of the end of December Total Stock Mutual Fund Assets were still below the record highs set in 2015, and are failing to confirm record price highs. (These data are collected by the Investment Company Institute and are published a month in arrears. January's totals won't be available until the end of this month.)
Source: ICI.com
We can see in the thumbnail that Total Assets did rise in December, but Net Cash Flow (bottom panel) was still negative. In fact, Net Cash Flow has been negative for most of the last two years, and was only positive one month in 2016. On the face of it, this is not a healthy situation.
The negative Cash Flow shows that investors have been taking some money off the table, at least off the closed-end mutual fund table. It is possible that some of that outflow could be caused by money moving into ETFs, which have become increasingly popular in the last ten years, but I am not so sure about that.
CONCLUSION: The negative divergence of Total Assets to price shows that prices are being driven higher by lower dollar volume. This undermines the the rally, and could result in problems in the future. As I look at the chart, I can't see any similar negative divergences in the past, so I think we should consider this a significant issue.
The NEW DecisionPoint LIVE public ChartList has launched! Click on the link and you'll find webinar charts annotated just before the program. Additional "chart spotlights" will be included at the top of the list. Be sure and bookmark it!
Come check out the DecisionPoint Report with Erin Heim on Wednesdays and Fridays at 7:00p EST, a fast-paced 30-minute review of the current markets mid-week and week-end. The archives and registration links are on the Homepage under “Webinars”.
Technical Analysis is a windsock, not a crystal ball.
Happy Charting!
- Carl

